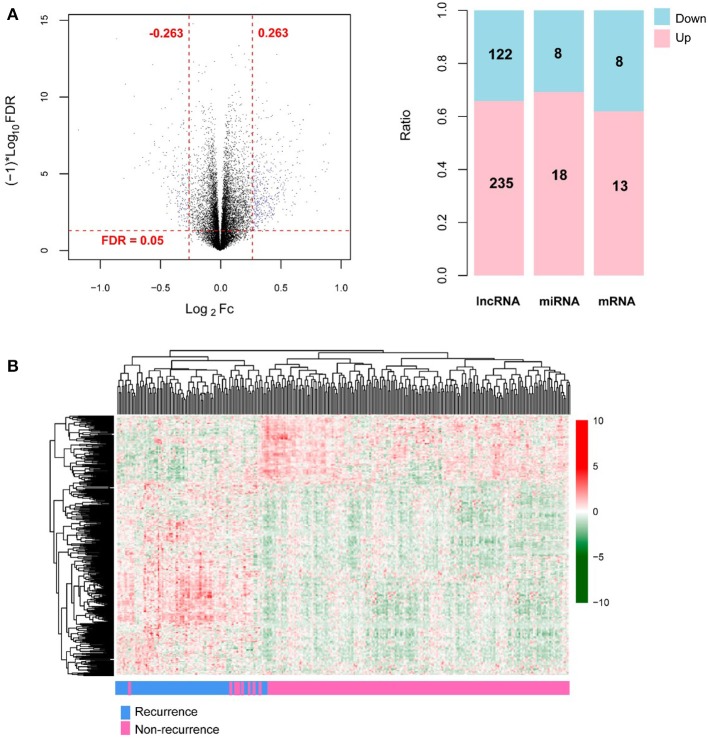
Figure 1.
The screening results of differentially expressed RNAs (DERs). (A) The volcano plot (left; the horizontal dashed line represents false discovery rate (FDR) < 0.05, and the vertical dashed lines represent |log2 fold change (FC)| > 0.263; the blue dots indicate DERs; FC: fold change) and the histogram showing the proportional distribution of different kinds of DERs (right; pink and blue separately represent up-regulation and down-regulation; lncRNA: long non-coding RNA, miRNA: microRNA); (B) The hierarchical clustering heatmap (in sample strip, blue and pink separately represent recurrence samples and non-recurrence samples).

