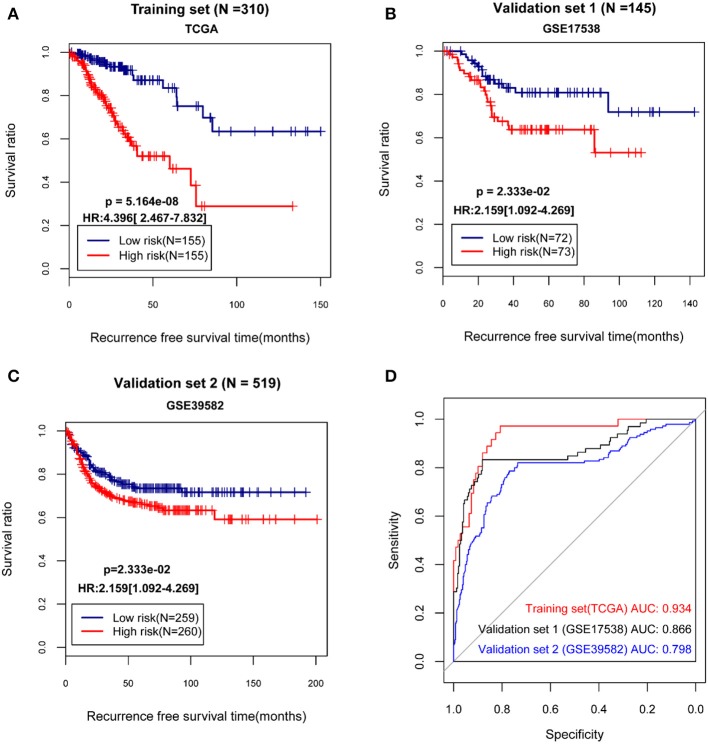
Figure 2.
The Kaplan-Meier (KM) curves and receiver operating characteristic (ROC) curves showing the correlations between the grouping based on the risk score system and the actual recurrence prognosis. (A) The KM curves for The Cancer Genome Atlas (TCGA) dataset; (B) The KM curves for the validation set GSE17538; (C) The KM curves for the validation set GSE39582; (D) The ROC curves for the TCGA dataset and the validation sets; In KM curves, blue and red curves separately represent low risk group and high risk group. In ROC curves, red, black, and blue curves represent the TCGA dataset, the validation set GSE17538, and the validation set GSE39582, respectively. HR, hazard ratio; AUC, area under the receiver operating characteristic curve.

