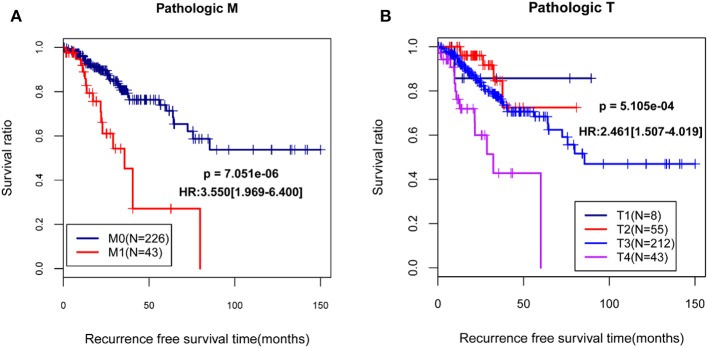
Figure 3.
The Kaplan-Meier (KM) curves showed the associations between pathologic M/pathologic T and recurrence prognosis. (A) The KM curves for pathologic M (blue and red curves separately represent the samples in pathologic M0 stage and pathologic M1 stage); (B) The KM curves for pathologic T (black, red, blue, and purples curves represent the samples in pathologic T1 stage, pathologic T2 stage, pathologic T3 stage, and pathologic T4 stage, respectively). HR, hazard ratio.

