Figure 1.
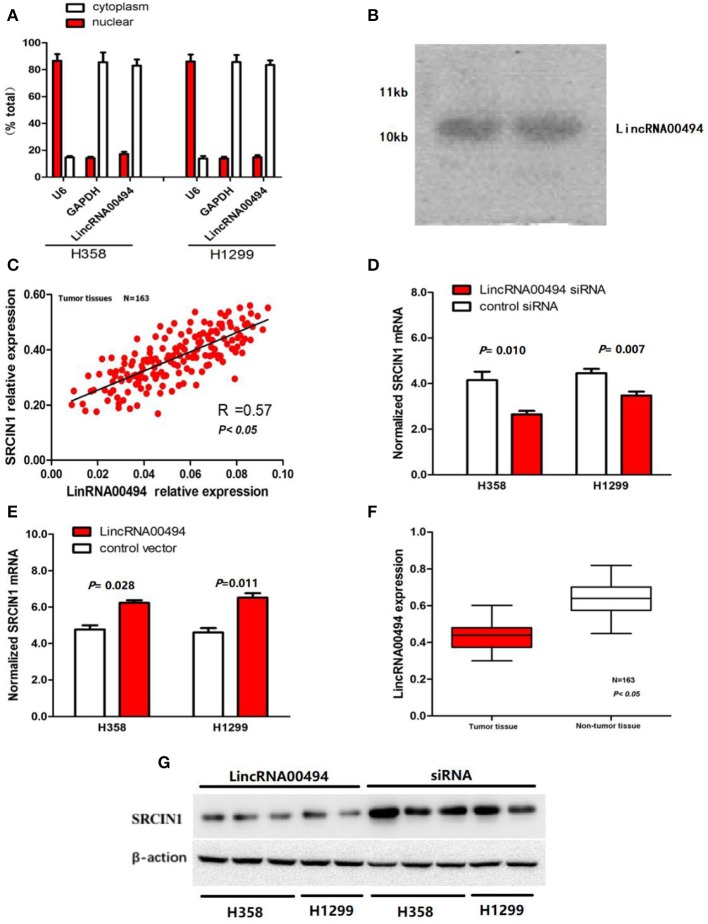
Cellular and molecular characterization of LincRNA00494. (A) The levels of the nuclear control transcript (U6), the cytoplasmic control transcript (GAPDH mRNA) and LincRNA00494 were assessed by RT-qPCR. Data are shown as the mean ± SEM. (B) A northern blot shows that LincRNA00494 is 10 kb. (C) The linear correlations between the LincRNA00494 expression and the SRCIN1 mRNA levels were tested. The relative expression value was normalized to the GAPDH expression level. (D,E) LincRNA00494 expression significantly affected SRCIN1 mRNA expression. Knockdown of LincRNA00494 decreased the SRCIN1 expression, while ectopic expression of LincRNA00494 increased the SRCIN1 mRNA levels. (F) LincRNA00494 was expressed at a lower level in the NSCLC tissues than in the matched tumor-adjacent tissues. The expression level of LincRNA00494 was analyzed by RT-qPCR and normalized to the GAPDH level. Data are represented as the mean ± SEM from three independent experiments. (G) The protein levels of SRCIN1 were assessed by Western blots of H358 cells and H1299 cells.

