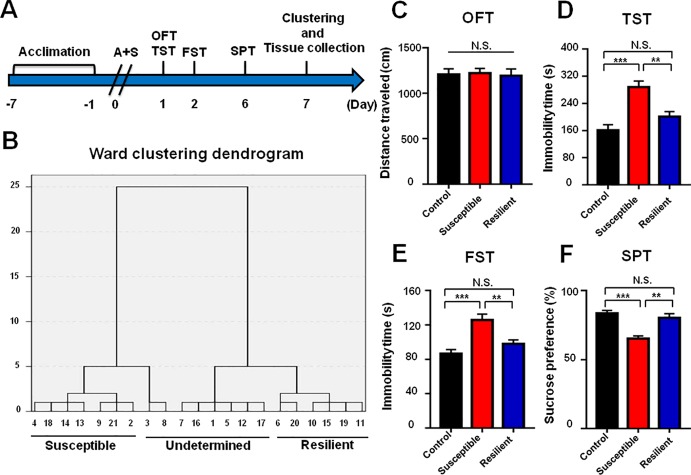
Figure 2.
Comparisons of behavioral results in control, POD susceptible, and resilient groups within 1 week postoperatively. (A) The schedule of A+S and behavioral tests. Behavioral tests, including OFT, TST, FST, and SPT were performed on day 1, 2, and 5 after A+S, respectively. Tissue samples were collected on day 7. (B) Dendrogram of hierarchical clustering analysis. A total of 21 mice after A+S were divided into depression susceptible, resilient, and undetermined groups by TST, FST, and SPT results of hierarchical clustering analysis. (C) OFT [F (2, 17) = 05446, P = 0.9472]. (D) TST [F (2, 17) = 15.66, P < 0.001]. (E) FST [F (2, 17) = 12.94, P < 0.001]. (F) SPT [F (2, 17) = 17.08, P < 0.001]. Data are shown as mean ± S.E.M. (n = 6~7). **P < 0.01 or ***P < 0.001. A+S, anesthesia and surgery; FST, forced swimming test; N.S., not significant; OFT, open field test; POD, postoperative depression; SPT, sucrose preference test; TST, tail suspension test.

