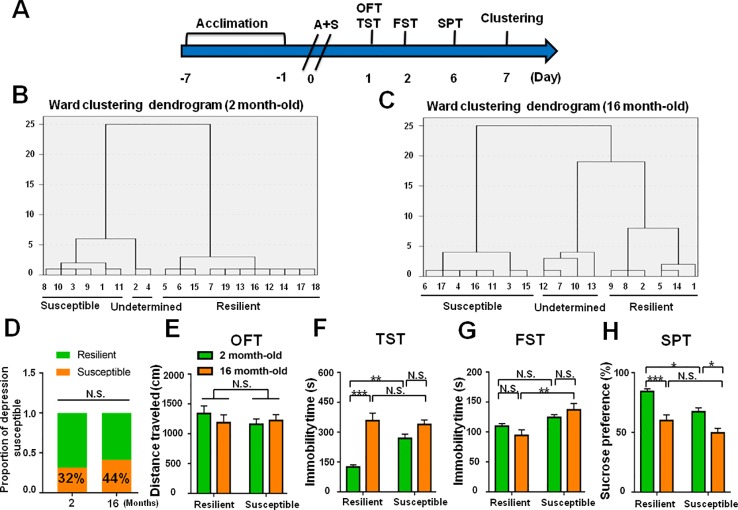
Figure 9.
Role of age deference in POD-like symptoms. (A) The schedule of this study. A+S was performed on day 0 after acclimation. Behavioral tests, including OFT, TST, FST, and SPT were performed on day 1, 2, and 5 after A+S, respectively. (B) Dendrogram of hierarchical clustering analysis. A total of 19 mice were divided into POD susceptible, resilient, and undetermined phenotypes by TST, FST, and SPT results. Six of 19 mice in 2 month-old group were POD susceptible phenotype. (C) Dendrogram of hierarchical clustering analysis. A total of 16 mice were divided into POD susceptible, resilient, and undetermined phenotypes by TST, FST, and SPT results. Seven of 16 mice were POD susceptible phenotype in 16 month-old group. (D) The ratios of depression-susceptible mice in 2 month-old and 16 month-old groups were 32% and 44% (Fisher's exact tests, P = 0.5031), respectively. (E) OFT [Phenotype: F (1, 22) = 0.3991, P = 0.5341; Age: F (1, 22) = 0.1418, P = 0.7101; interaction: F (1, 22) = 0.2509, P = 0.6214]. (F) TST [Phenotype: F (1, 22) = 7.521, P = 0.0119; Age: F (1, 22) = 37.1, P < 0.0001; interaction: F (1,22) = 12.37, P < 0.05]. (G) FST [Phenotype: F (1, 22) = 14.46, P = 0.001; Age: F (1, 22) = 0.1098, P = 0.7435; interaction: F (1, 22) = 2.687, P = 0.1154]. (H) SPT [Phenotype: F (1, 22) = 12.78, P < 0.01; Age: F (1, 22) = 32.66, P < 0.0001; interaction: F (1, 22) = 0.6142, P = 0.4416]. Data are shown as mean ± S.E.M. (n = 6~7). *P < 0.05, **P < 0.01, or ***P < 0.001. A+S, anesthesia and surgery; FST, forced swimming test; N.S., not significant; OFT, open field test; POD, postoperative depression; SPT, sucrose preference test; TST, tail suspension test.

