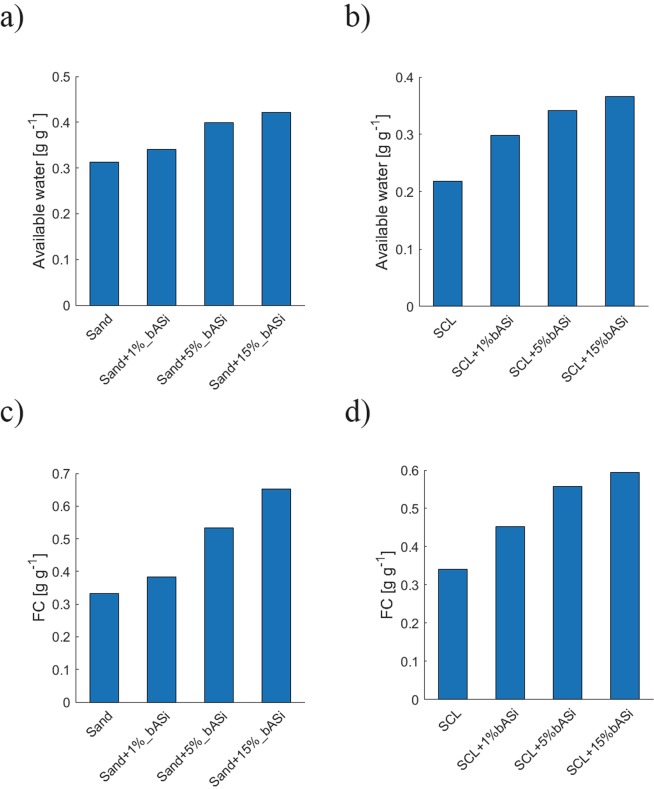
Figure 3.
Changes in soil available water and field capacity due to biogenic ASi. Available water of sand mixed with different contents of bASi (a), of a sandy clay loam (SCL) mixed with different contents of bASi (b) and field capacity of sand mixed with different contents of bASi (c), of a sandy clay loam (SCL) mixed with different contents of bASi (d). Significant linear relationship were found between available water and sand ASi content (Pearson r 0.92, p = 0.04) and SCL ASi content (Pearson r 0.96, p = 0.02) as well as between FC and sand ASi content (Pearson r 0.96, p = 0.02) and SCL ASi content (Pearson r 0.9, p = 0.05).

