
Figure 1.
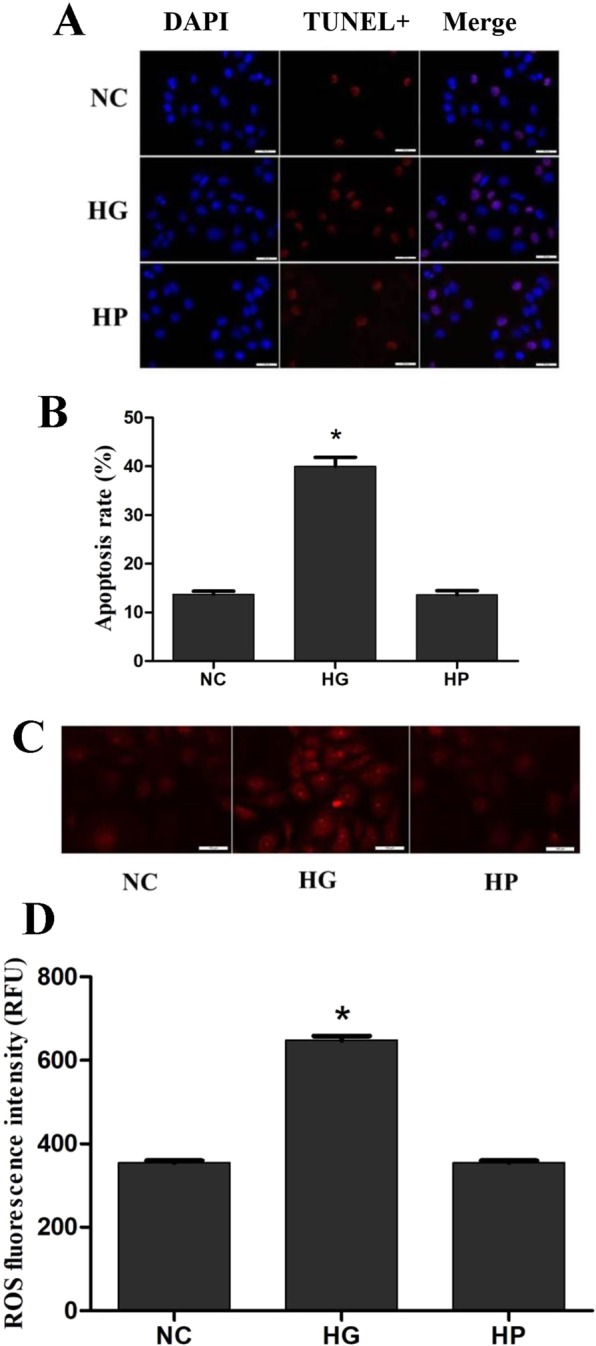
High glucose induces RRPs apoptosis and oxidative stress. RRPs were cultured for 2 days in different media. (A) High glucose induces RRPs apoptosis detected using TUNEL staining. Blue indicates DAPI-stained nuclei, while red indicates TUNEL-positive cells. (B) Quantification of TUNEL staining showing that more RRPs apoptosis in the HG group than the NC and HP groups. (C) Intracellular ROS levels were measured with the fluorescent probe DCFH-DA, and images were obtained by fluorescence microscopy. (D) The ROS fluorescence intensity values were calculated using Adobe Photoshop version 7.0. The ROS levels of RRPs in the HG group were significantly higher than those of RRPs in the NC group. RFU: relative fluorescence unit. All data are presented as means ± SEM(n = 3/group). *P < 0.05 vs NC, HP.