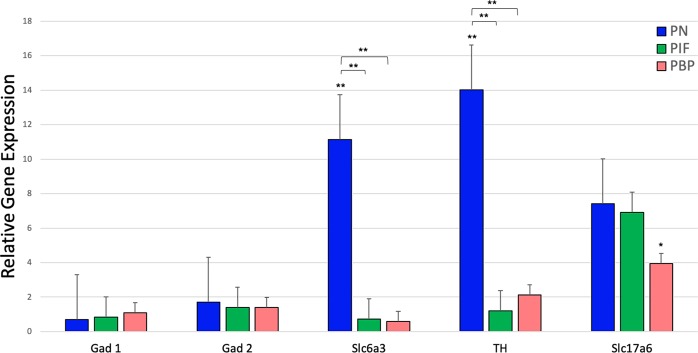
Figure 2.
Relative gene expression of GABA, DA, and glutamate markers by VTA sub-region after the nicotine exposure in the rats. The results of quantitative RT-PCR validation experiments showed in the graph represent the fold change in the expressions of the selected genes relative to the expression of the housekeeping gene GAPDH. The red bars indicate the expressions of the selected genes in PBP, green bars indicate the expressions of the selected genes in PIF and blue bars indicate the expressions of the selected genes in PN. Two-way analysis of variance (ANOVA) was used to assess the difference between each gene within the sub-regions. Unpaired t-test was used when comparing gene expression profiles between nicotine and saline treatment groups in the sub-regions. *denotes p < 0.05, **denotes p < 0.01. Data is presented as mean ± SEM.

