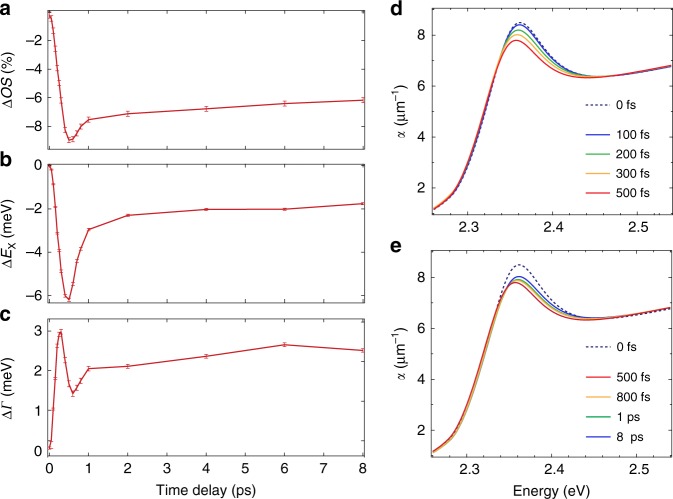
Fig. 3. Reflectivity lineshape analysis.
a–c Temporal evolution of the oscillator strength (ΔOS, a), peak position (ΔEx, b) and linewidth (ΔΓ, c), obtained through the fit of ΔR∕R(ω, t) at the excitation density of n = 5 × 1018 cm−3. d, e Evolution of the absorption spectra α(ω, t) of CH3NH3PbBr3 single crystals in the vicinity of the excitonic resonance as calculated with the Tauc-Lorentz fit of ΔR∕R(ω, t) in the temporal windows (d) from 0 fs to 500 fs and (e) from 500 fs to 8 ps.

