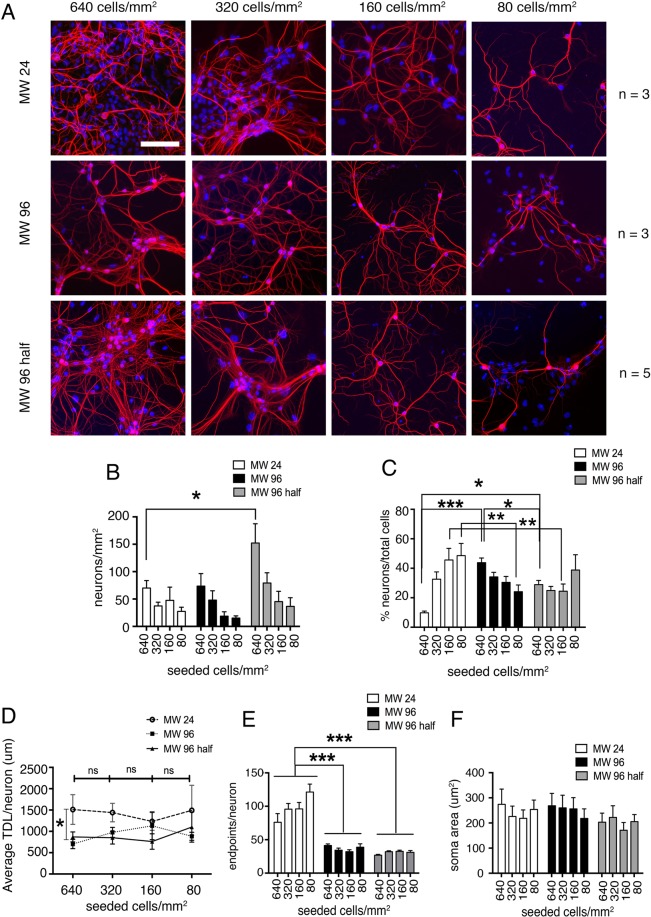
Figure 3.
Effect of different well-size on dendrites of wild-type mouse hippocampal neuron. (A) DIV 12 mouse hippocampal neurons immunostained for dendrite cytoskeleton (MAP2 red) and nuclei (Hoechst blue) plated at different seeding cell densities in different polystyrene plates: MW 24 (top line), MW 96 (middle line) and MW 96 half-surface (bottom line). (Scale bar = 100 µm) (B) Quantitative data on the number of neurons per mm2 counted at the different seeding cell densities. Data are expressed as mean ± SEM, n = 3 cultures per condition on MW 24, n = 3 cultures per condition on MW 96 and n = 5 cultures per condition on MW 96 half. (C) Number of neurons (%) normalized on the number of counted viable nuclei (total cells), (D) Average TDL per neuron (µm), (E) average number of dendrite endpoints per neuron and (F) average neuronal soma area (µm2). Kruskal-Wallis test corrected for multiple comparisons (Dunn’s correction) on panel C. Two-way ANOVA corrected for multiple comparisons (Dunn’s correction) to compare the different plates and cellular densities (B–F). For both, P > 0.05, *P ≤ 0.05, **P ≤ 0.01, ***P ≤ 0.001.

