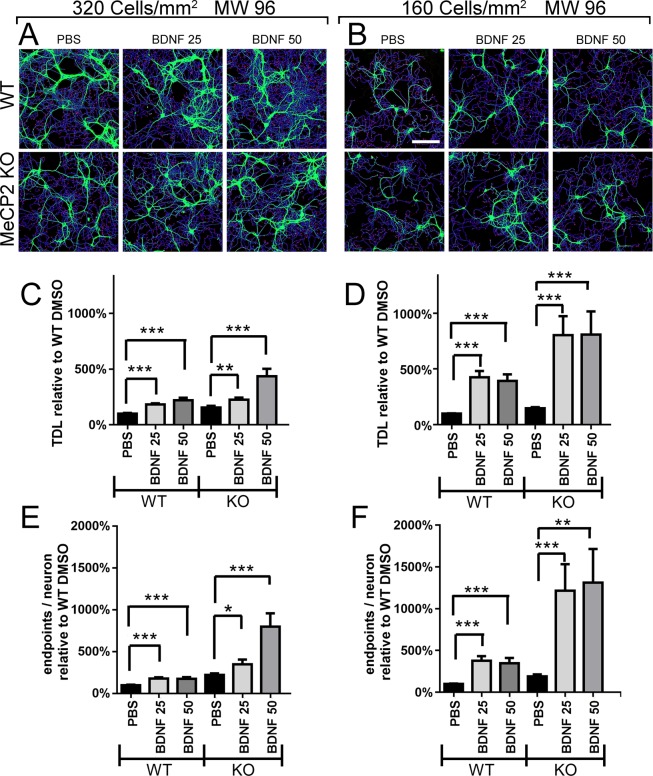
Figure 6.
BDNF effects on TDL and endpoints. (A) NeuriteQuant morphological analysis of TDL (blue lines) and endpoints (red spots) of WT and MeCP2 KO DIV 12 mouse hippocampal neurons at 320 cells/mm2 (n = 3), and (B) 160 cells mm2 (n = 4) immunostained for dendrite cytoskeleton (MAP2 green). Both WT and MeCP2 KO neurons were treated (from left to right) with PBS, BDNF 25 ng/ml, BDNF 50 ng/ml for 3 days from DIV 9 to DIV 12. (C,E) Quantitative data of average TDL per neuron (µm) and average number of endpoints per neuron at 320 cells/mm2 and (D,F) 160 cells/mm2, respectively. N = 3 cultures, each in duplicate wells. Grubbs test for outlier detection and removal with significance level α = 0.05 (two-sided). One-way ANOVA with Dunnett’s multiple comparisons test vs PBS conditions. ***P < 0.001, **P < 0.01, *P < 0.05.

