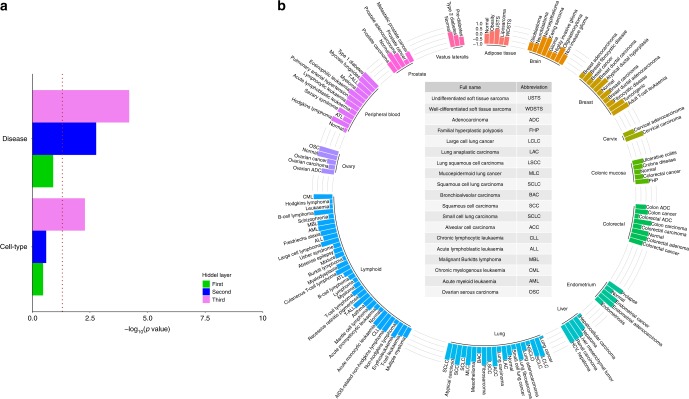
Fig. 4. Deep autoencoder (deepAE) representation clustering samples into cell types and diseases.
a Significance score (−log10(p)) for first (green), second (blue), and third (violet) deepAE layers are more coherent (measured by a high Silhouette index (SI)) with respect to cell types (lower) and diseases (upper) than the standard principal component (PC) analysis-based approach. b SI defined by the two PCs for diseases and control samples on compressed signals at the third hidden of deepAE with each of the three hidden layers having 512 nodes.

