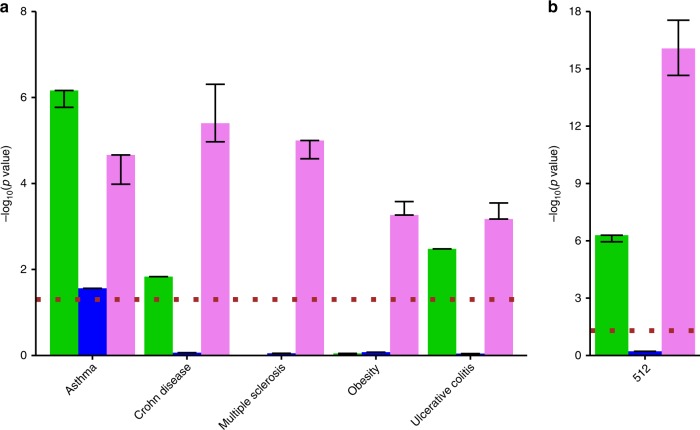
Fig. 6. Generalization of disease association enrichment results in the deep autoencoder (deepAE) of derived gene sets using RNA-seq data.
a Enrichment score (−log10(P)) resulting from the hyper-geometric test between disease gene overlap of the predicted genes by the deep neural network derived by the first (green), second (blue), and third (violet) hidden layers, of the deepAE. b Fisher’s combined p value across all five complex diseases predicted by the three-layer deep autoencoder. The dotted (brown) line corresponds to the p value, cut-off 0.05.

