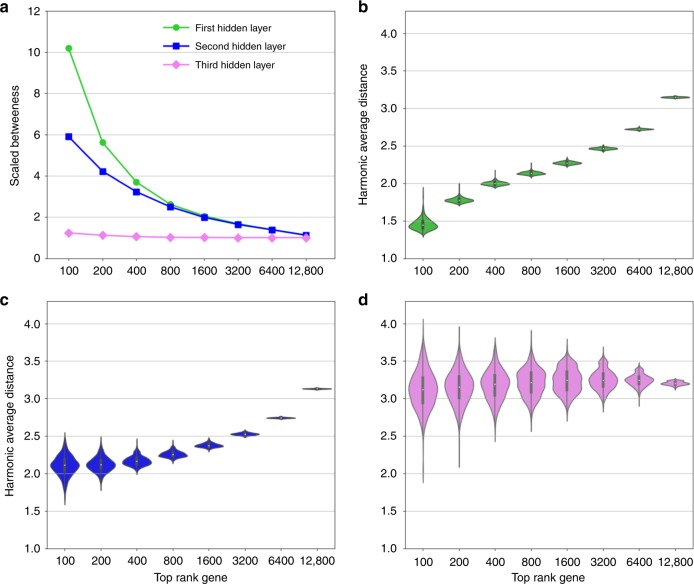
Fig. 7. RNA-seq replicated gene co-localisation pattern from micro-array data.
a Betweenness centrality behavior of the top ranked genes on the basis of the first (green), second (blue), and third (violet) hidden layers of the deep autoencoder trained on the RNA-seq data. b–d Distribution of harmonic average distances of the top rank genes based on each hidden node of the first, second, and third hidden layers of the deep autoencoder respectively.

