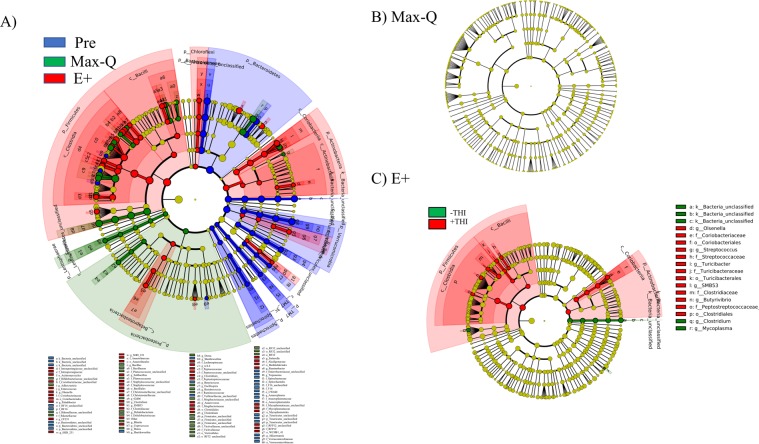
Figure 1.
Linear discriminant analysis (LDA) effect size (LEfSe; Kruskall-Wallis [P < 0.05]; Pairwise Wilcoxon [P < 0.05]; logarithmic LDA score > 2.0) of the fecal microbiota of (A) Angus steers before (Pre) placement or across a 26-day grazing trial after placement on either a non-toxic (Max-Q; n = 6) or toxic (E+; n = 6) endophyte-infected tall fescue; (B) steers grazing Max-Q tall fescue on Day 12 (- temperature humidity index [−THI]) versus Day 20 (+THI); (C) steers grazing E+ tall fescue on Day 12 (−THI) versus Day 20 (+THI). (A) Blue, green, and red shading indicates greater abundance in Pre, Max-Q, or E+ steers, respectively (C) Green and red indicates greater abundance in E+ steers on Day 12 (−THI) and 20 (+THI), respectively. Taxonomic rank labels are provided before bacterial names: “p_; c_; o_; f_; g_” indicate phylum, class, order, family, and genus, respectively. Letters and numbers within the cladogram refer to bacterial names located in the keys below (panel A) and to the right (panel C) of the cladogram.

