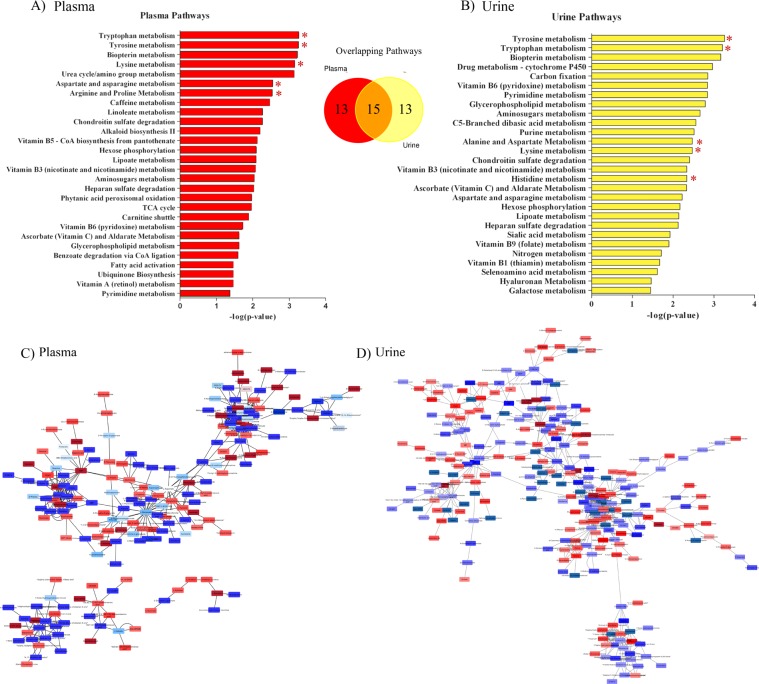
Figure 2.
Pathway analysis performed on the (A) plasma (red) and (B) urine (yellow) high-resolution metabolomics features using the mummichog python program that indicates putative metabolic pathways significantly (P < 0.05) affected by toxic tall fescue (E+) grazing in beef steers throughout the 26-day grazing trial (n = 12). The x-axis indicates the negative log of the FDR corrected p-value for each metabolic pathway indicated on the y-axis. The Venn Diagram details the number of metabolic pathways that were significantly affected by E+ grazing in the plasma (red), urine (yellow), or in both (overlapping). Red asterisk indicates production (i.e., weight gain)-related metabolic pathways. Temporally merged activity networks for the (C) plasma and (D) urine resultant from the mummichog pathway analysis detailing specific putatively annotated metabolites that were either significantly increased (red) or decreased (blue) in steers grazing E+ (n = 6) tall fescue when compared to steers grazing a non-toxic tall fescue (n = 6) over the course of a 26 day grazing trial.

