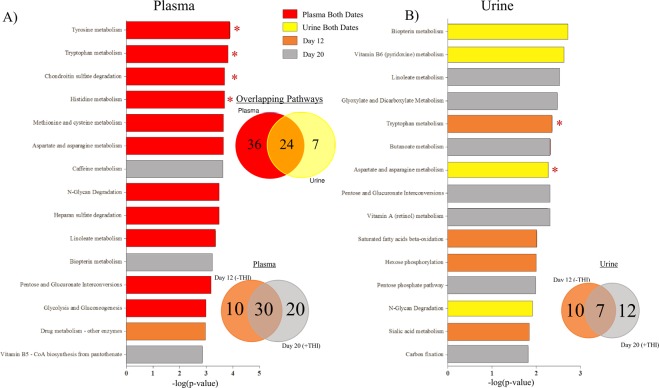
Figure 3.
Top 15 pathways from pathway analysis performed on the (A) plasma and (B) urine high-resolution metabolomics features using the mummichog python program within Day 12 (−THI) and 20 (+THI), with putative pathways that are significantly affected by toxic tall fescue (E+) grazing solely on Day 12 (−THI; orange), only on Day 20 (+THI; gray), or on both dates (plasma = red; urine = yellow). The Venn diagrams detail the number of putative metabolic pathways that were affected in the plasma and/or urine (top) or in the plasma on Day 12 and/or Day 20 and (bottom left) or in the urine on Day 12 and/or Day 20 (bottom right).

