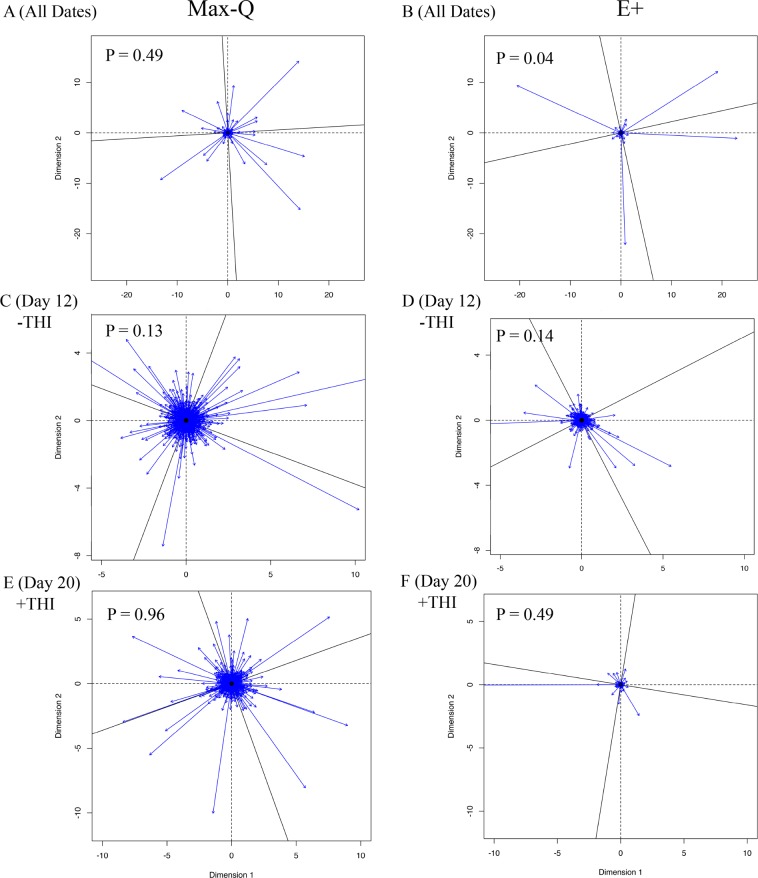
Figure 4.
Procrustes analysis performed using the vegan R package for steers grazing either a (A; Max-Q; n = 6) novel, non-toxic or (B; E+; n = 6) toxic endophyte-infected tall fescue over the course of a 26-day grazing trial; Max-Q steers on Day 12 (C; −THI) and Day 20 (E; +THI) and E+ steers on Day 12 (D; −THI) and Day 20 (F; +THI). The significance values were estimated using the protest function to perform permutational Procrustes, with the P values reported in the upper left hand side of each respective plot. The greater vector length is indicative of greater inter-‘omic variability.

