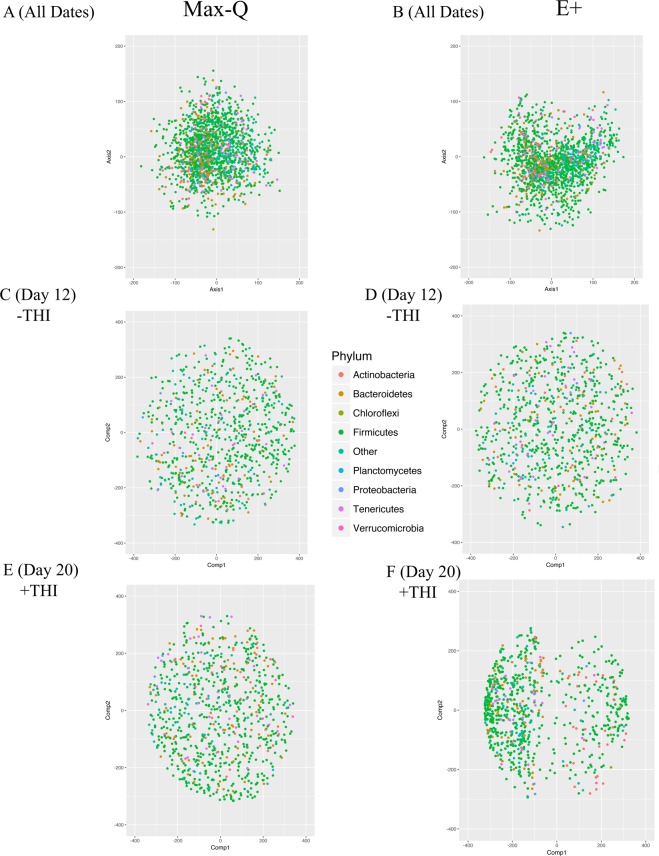
Figure 5.
Coinertia analysis performed on OTUs for steers grazing either a (A; Max-Q; n = 6) novel, non-toxic or (B; E+; n = 6) toxic endophyte-infected tall fescue over the course of a 26-day grazing trial; Max-Q steers on Day 12 (C; lowest −THI) and Day 20 (E; highest +THI) and E+ steers on Day 12 (D; −THI) and Day 20 (F; +THI). Each point is plotted based on the OTUs predicted covariance with the plasma and urine metabolomes (i.e., greater distance from the point of origin indicates a greater covariance) of the respective group of steers. Red = Actinobacteria, brown = Bacteroidetes, green = Firmicutes, teal = other (unclassified, Planctomycetes, Chloroflexi, and other low abundance phyla), blue = Proteobacteria, purple = Tenericutes, and pink = Verrucomicrobia.

