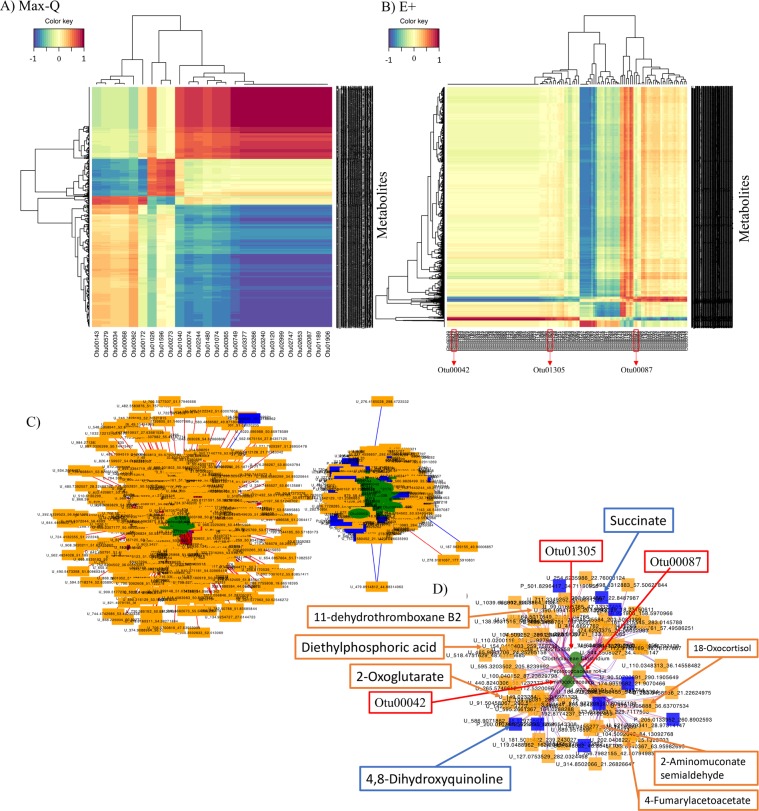
Figure 6.
Heat maps representing fecal 16S rRNA OTUs and plasma high-resolution metabolomics (HRM) features that were selected by sparse partial least squares regression (sPLS) and high correlation (|r| > 0.7) in steers grazing either a novel, non-toxic (A; Max-Q; n = 6) or toxic (B; E+; n = 6) tall fescue over the course of a 26 day grazing trial. Red and blue indicates positive and negative correlations, respectively. Select OTUs proposed as potential E+ -associated microbiota biomarkers are boxed in red on the x-axis of panel B. Bipartite network of fecal 16S rRNA OTUs (green circles) and plasma (orange rectangles) and urine (blue rectangles) high-resolution metabolomics (HRM) features that were selected by sparse partial least squares regression (sPLS; top 100 OTUs [X matrix] and 500 plasma and urine HRM features [Y matrix]) using the mixOmics R package and were highly correlated (|r| > 0.7) (C) throughout the grazing trial and (D) a subnetwork of selected OTUs (green circles) that correlated with average daily weight gains, urinary ergot alkaloids (biomarkers of exposure and key etiological agents of FT), and THI, with the plasma (blue rectangles) and urine (red rectangles) HRM features that were highly correlated (|r| > 0.7) with these OTUs in the original network. Red and blue edge indicates positive or negative correlations, respectively. Select OTUs proposed as potential E+ -associated microbiota biomarkers pointed to by red arrows as the anchors of the network in panel D. Select plasma (blue box and arrows) and urine (orange box and arrows) metabolic features identified in the subnetwork have been highlighted in panel D.

