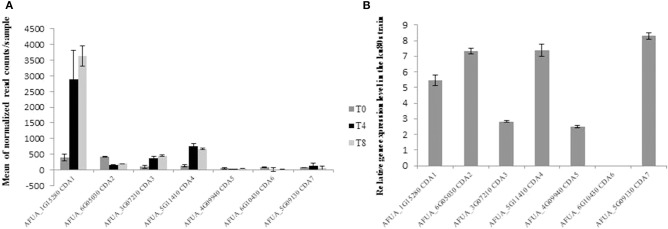
Figure 4.
CDA gene expression level in A. fumigatus (A) Gene expression profile of the KU80 CDA family genes in dormant (T 0 h), swollen (T 4 h), and germinated conidia (T 8 h) in Glucose 3%/YE 1% medium. The data are extracted from RNAseq analysis data (Mouyna et al., 2016). The errors bars represent standard deviation from the mean values of three different experiments. The data have been normalized/size of the gene (B) Relative Gene expression level of the CDA genes in the mycelium during conidiation of the parental strain (WT). The expression ratios were relative to TEF1 gene. Values are taken from the RNA-seq data analysis of Valsecchi et al. (2017). For this RNA-sequencing experiment, the fungus was grown for seven days on malt agar at 37°C at room temperature. The errors bars represent standard deviation from the mean values of three different experiments.

