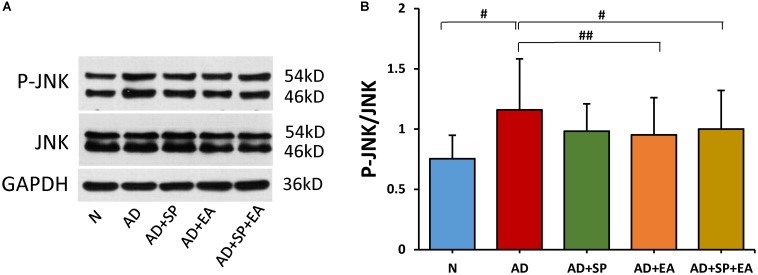
FIGURE 4.
Comparison of the expression of JNK in the hippocampus of APP/PS1 mice using WB. (A) The relative expression of hippocampal phosphorylated JNKs and total JNKs in APP/PS1 mice. (B) The ratio of p-JNK expression level to the total JNK level in the hippocampus of APP/PS1 mice. Data are presented as the means ± SD, WB: n = 7 per group. #p < 0.05; ##p < 0.01.

