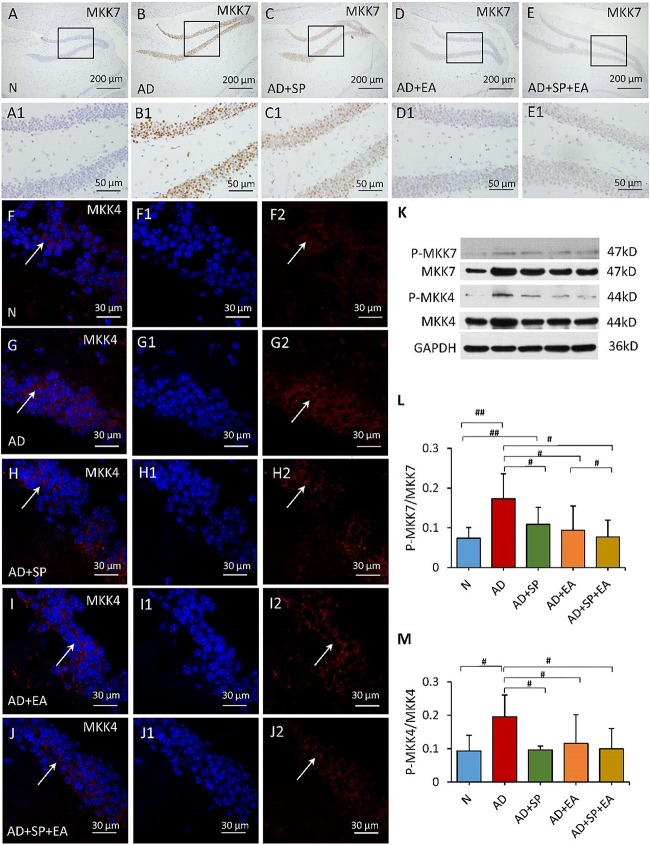
FIGURE 5.
Comparison of MKK7 and MKK4 expression in the hippocampus of APP/PS1 mice in each group. (A–E) Comparison of MKK7 expression using immunohistochemistry. (A1–E1) Comparison of MKK7 expression in the square frame of (A–E) in detail. (F–F2,G–G2,H–H2,I–I2,J–J2) Comparison of MKK4 expression using immunofluorescence. MKK4: red; DAPI: blue; White arrows indicate positive expression of MKK4. (K) The relative expression of hippocampal phosphorylated MKK7 and MKK4 and total MKK7 and MKK4 in APP/PS1 mice. (L,M) The ratio of p-MKK7 and p-MKK4 expression level to the total MKK7 and MKK4 level in the hippocampus of APP/PS1 mice. Data are presented as the means ± SD, WB: n = 7 per group, immunofluorescence: n = 3 per group. #p < 0.05; ##p < 0.01.

