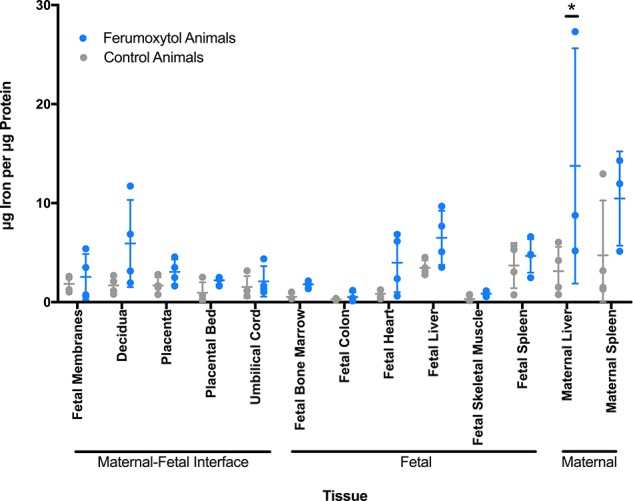
Figure 4.

Iron content of maternal and fetal tissues. Iron content of selected tissues was determined by mass spectrometry. Non-imaged animals are represented by gray circles (n = 4). Animals that received ferumoxytol imaging with intra-amniotic saline are in blue (n = 4, except for maternal liver and maternal spleen where n = 3). Mean and standard error are denoted by horizontal lines for each tissue.
