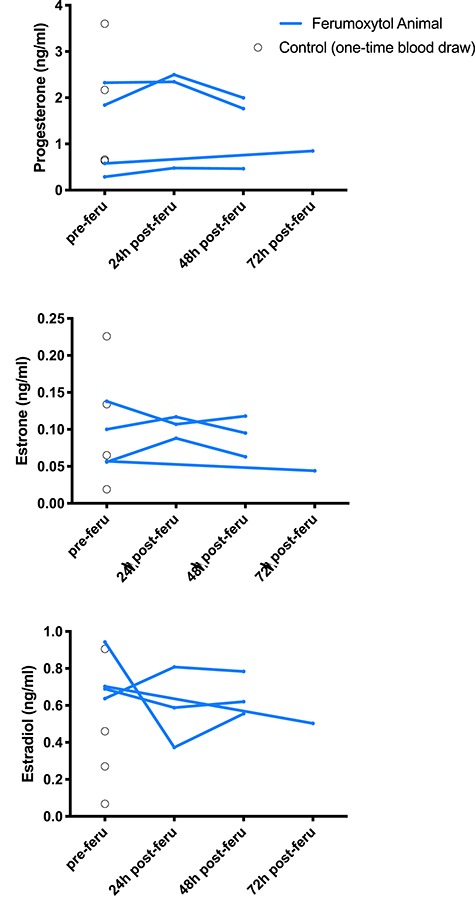
Figure 5.

Plasma hormone levels in MRI animals assessed by mass spectrometry. Blue lines represent progesterone, estrogen, and estradiol levels in ferumoxytol-infused animals before injection, 24 h following injection, and 48 or 72 h following injection. Black circles represent single blood draw readings from non-ferumoxytol control animals, indicating the expected range of peripheral blood steroid hormone levels in pregnant macaques.
