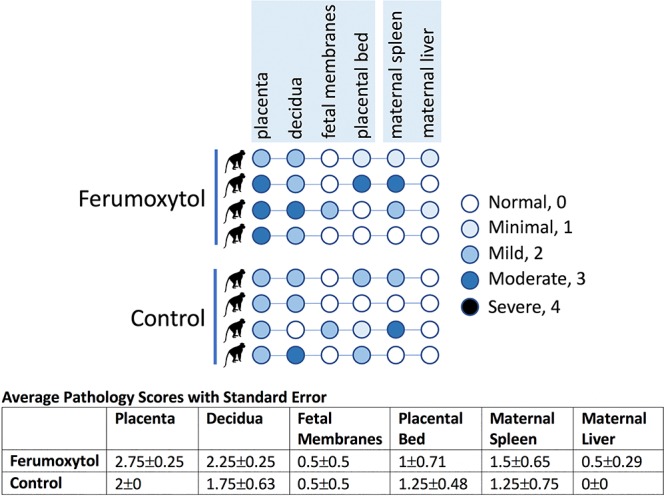
Figure 6.

Chart summarizing histopathology scores of all tissues that showed pathology. For each animal, the circle representing each tissue is colored to denote severity of pathology. The top four rows represent the ferumoxytol-receiving intra-amniotic saline animals and the bottom four rows are for non-ferumoxytol non-MRI controls. Numbers were assigned to each severity rating and used to analyze pathologies (normal = 0, minimal = 1, mild = 2, moderate = 3, severe = 4). The chart below presents the average pathology scores for each tissue per treatment, used to assess statistical significance.
