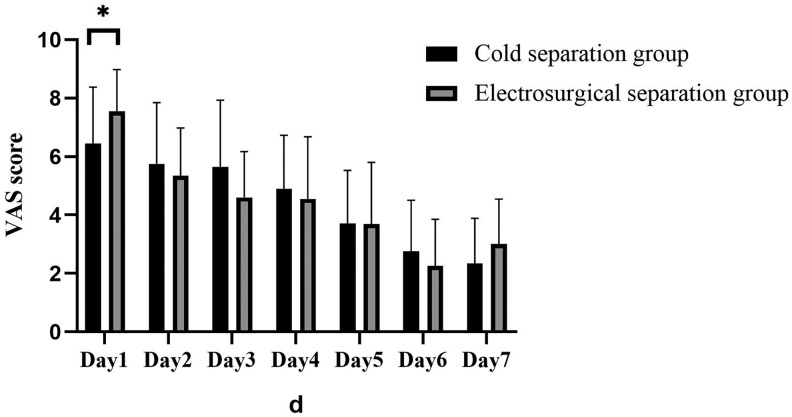
Figure 4.
There was significant difference between 2 groups in terms of VAS score on the first day (cold method group 6.45 + 1.93 vs electrosurgical separation group 7.55 + 1.43, p = 0.048. And the trend of VAS score was similar to that of drainage. P value <.05, *; .01, **. VAS indicates visual analogue scale.

