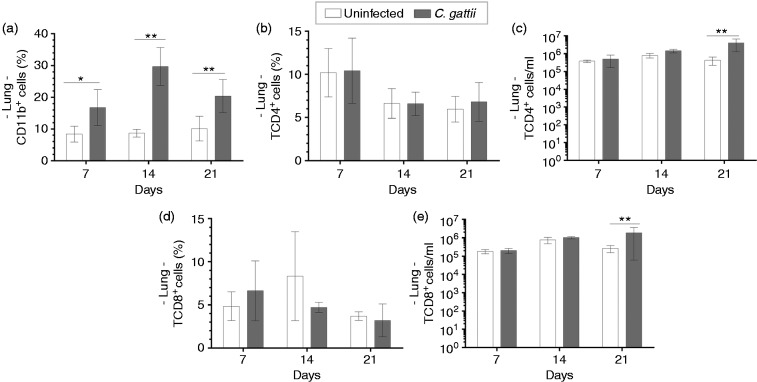
Figure 3.
Relative frequency of TCD4+ and TCD8+ cells in the lung tissue of infected mice. Frequency and/or cell concentration of (a) CD11b+, (b and c) CD4+ T cells and (d and e) CD8+ T cells by flow cytometry on d 7, 14 and 21 post infection. Animals receiving PBS were considered negative controls (uninfected mice). Results are expressed as percentages and represent the mean ± SD. Differences were considered significant when *P < 0.05 and **P < 0.01 relative to uninfected controls.

