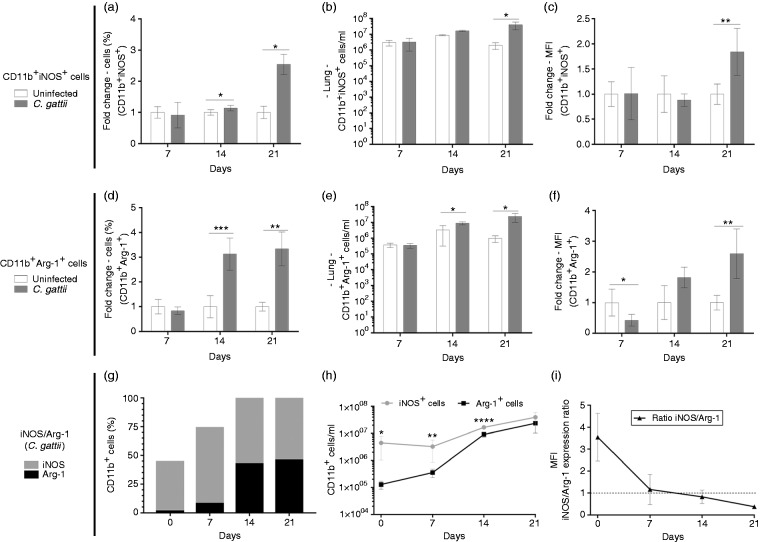
Figure 6.
Phenotype of CD11b+iNOS+ and CD11b+Arg-1+ cells in the lung tissue of BALB/c infected with C. gattii. (a–c) CD11b+ and CD11b+iNOS+ or (d–f) CD11b+Arg-1+ cells were quantitated by flow cytometry. Frequency, cell concentration and mean fluorescence intensity were evaluated. The fold change in (a), (c), (d) and (f) is shown as the ratio between the value from each infected mouse and the mean value of the uninfected group. (g and h) CD11b+iNOS+/CD11b+Arg-1+ in C. gattii–infected mice using the percentage and cell concentration of (a and b) CD11b+iNOS+ and (d and e) CD11b+Arg-1+ cells. (i) Mean fluorescence intensity of CD11b+iNOS+ and CD11b+Arg-1+ cells quantified by flow cytometry was used to calculate the iNOS/Arg-1 ratio. The injection of PBS alone (uninfected mice) was used in the uninfected controls. Results are expressed in percentages and represent the mean ± SD. Differences were considered significant when *P < 0.05, **P < 0.01 and ***P < 0.001 relative to uninfected controls.

