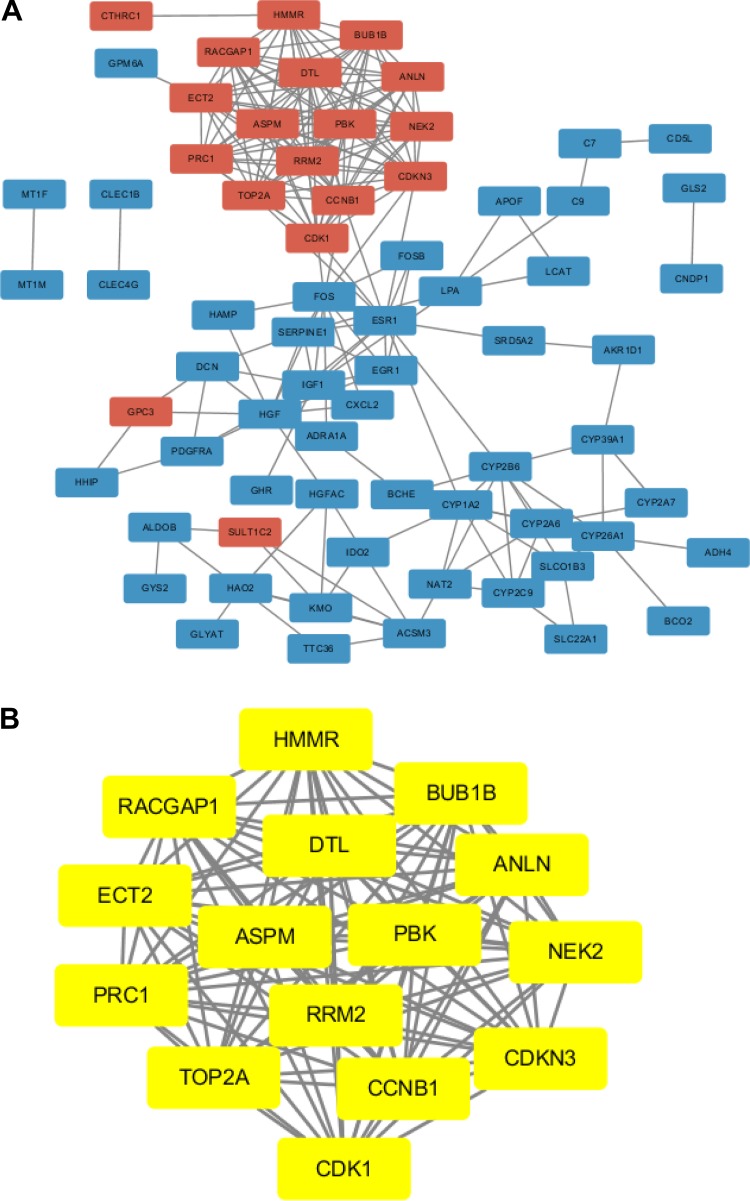
Figure 2.
Identification of hub genes from the DEGs by STRING and MCODE. A. A PPI network was constructed; red nodes represent upregulated genes, and blue nodes represent downregulated genes. B. The hub genes (yellow nodes) with a degree cut-off = 2, haircut on, node score cut-off = 0.2, k-core = 2, and max. depth = 100 were screened with MCODE.

