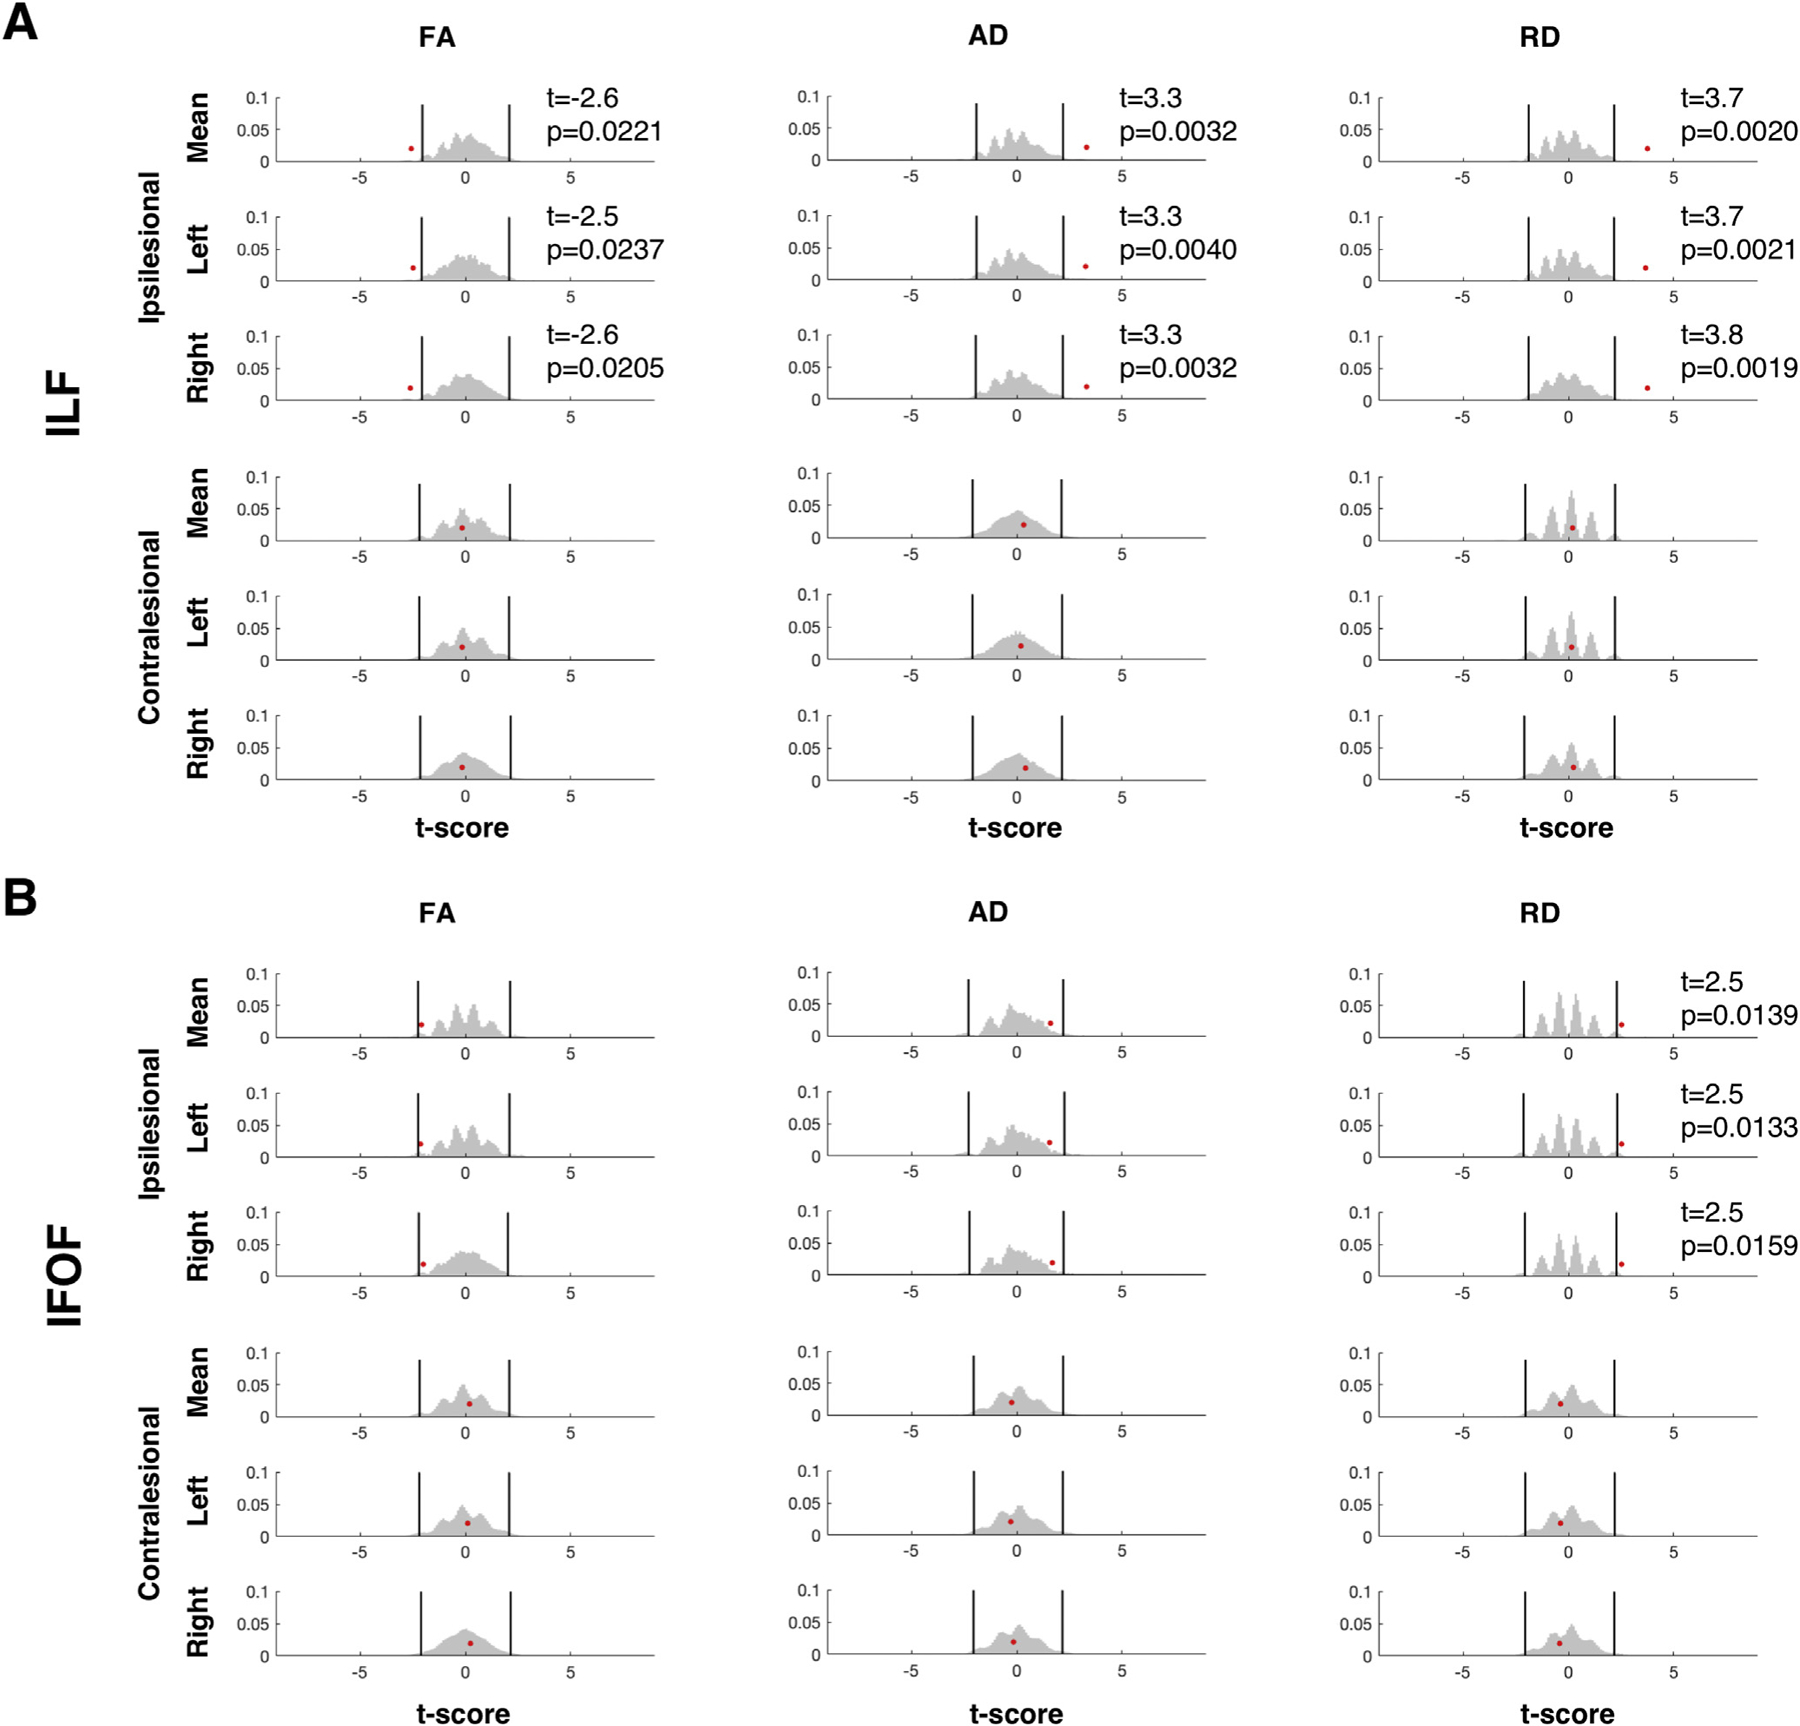
Fig. 2. Group comparison of microstructural indices between VOTC resection patients and controls.

Results of permutation testing of mean microstructural indices of the (A) ILF and (B) IFOF. There were significant group differences at α = 0.05 between controls and patients (red dots) for all measures in ipsilesional ILF but only in RD for the IFOF. Both contralesional tracts had group differences of p > 0.11 across all microstructural indices. Patient data were compared to the mean of the indices of both hemispheres in controls (top rows) or to indices from either hemisphere (2nd and 3rd rows). Black vertical lines indicate upper and lower 2.5th percentile of the null distribution (gray histogram).
