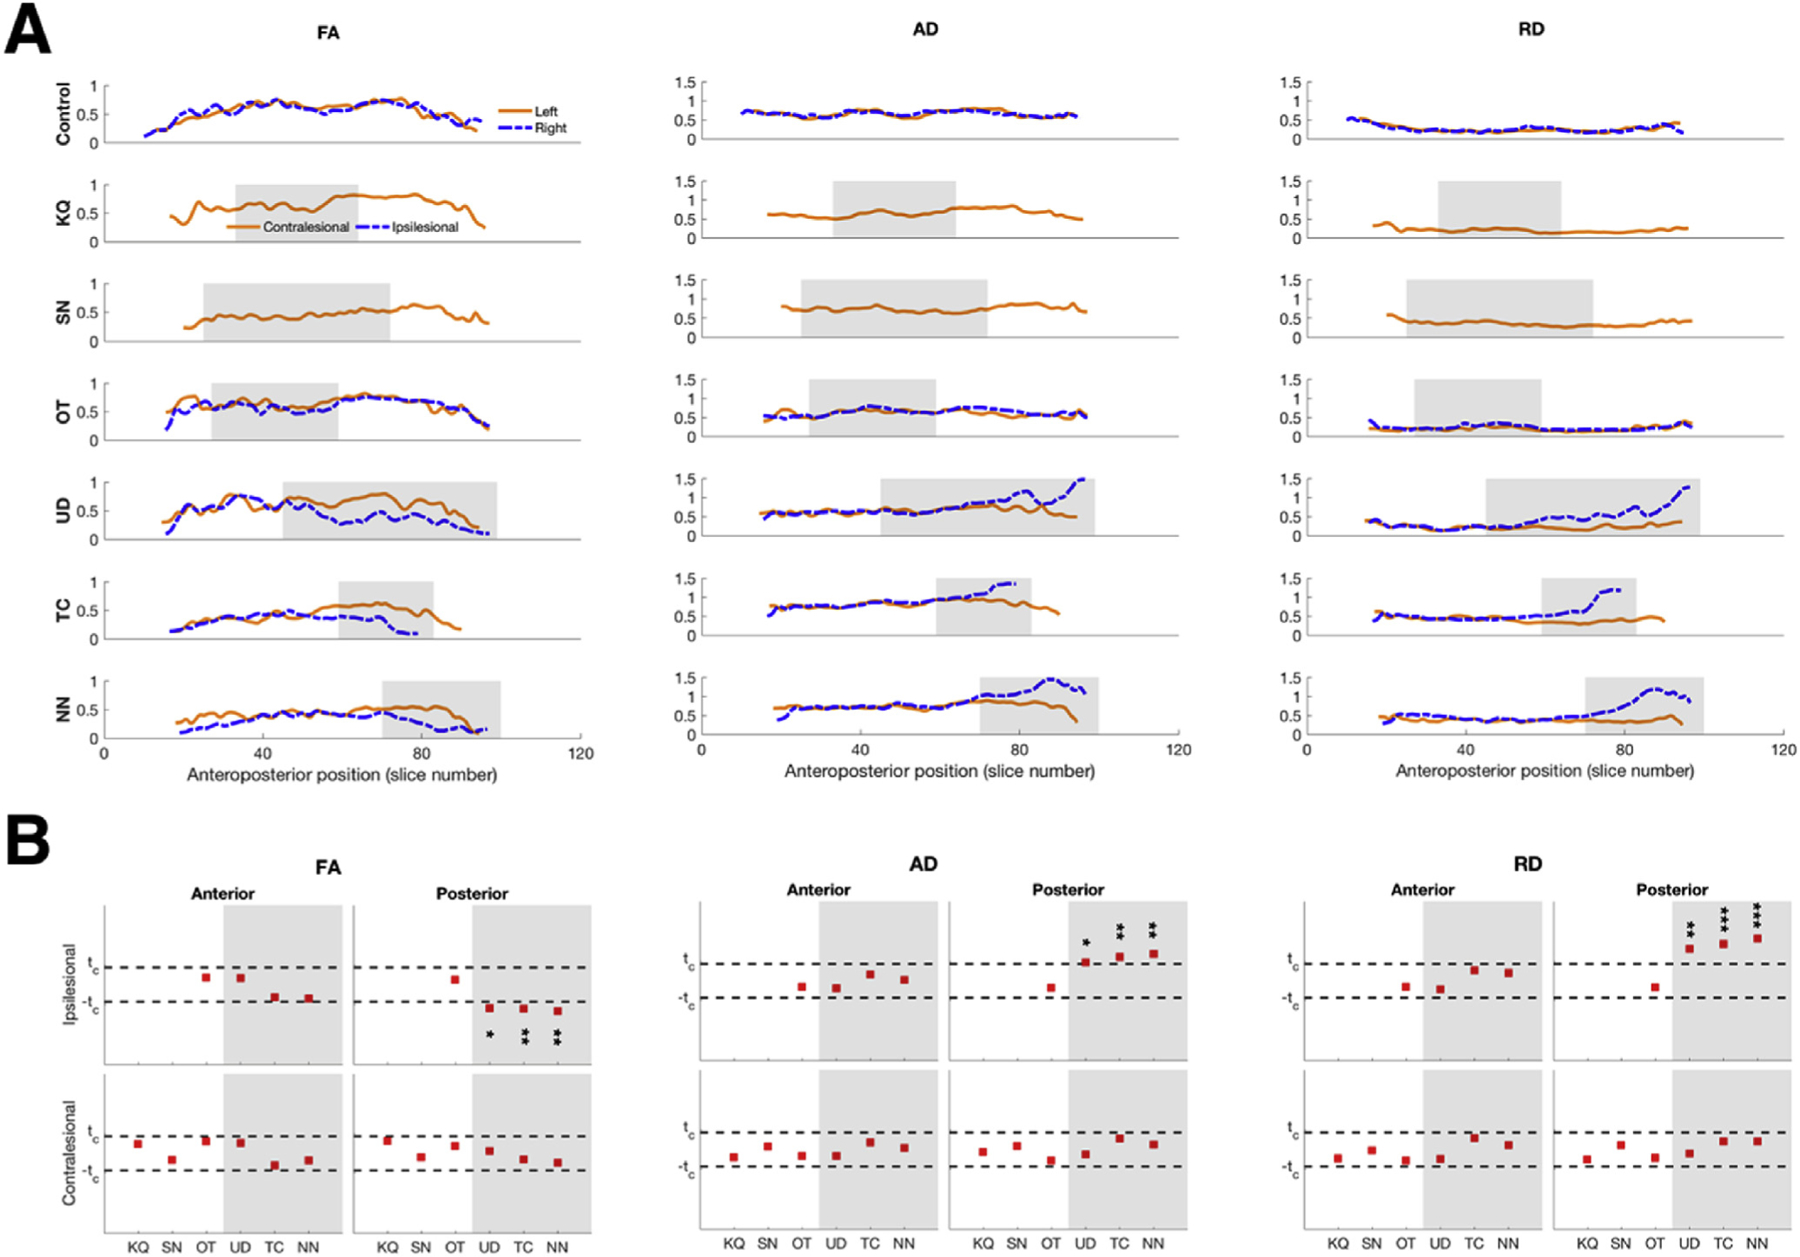
Fig. 4. Microstructural indices of the IFOF.

(A). Anteroposterior profiles of FA, AD, and RD in an exemplar control and in patients with resections to their VOTC. Shaded regions indicate extent of resection. (B). Single-subject comparisons against normative group values showed significant differences between ipsilesional and corresponding IFOF in controls only for values in patients with posterior resection. Shaded areas indicate patients with posterior resection, white areas indicate patients with anterior resection. p-values uncorrected for multiple comparisons: *p < 0.05,** p < 0.01,*** p < 0.001.
