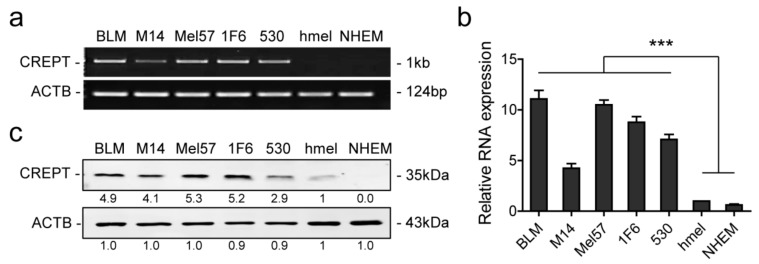
Figure 1.
CREPT is highly expressed in melanoma cells compared to melanocytes. (a) Representative pictures of RT-PCR to show CREPT expression in all cell lines. (b) Quantitative PCR is displayed as mean ± SEM and statistical analysis was conducted with hmel as the control group. (c) Representative pictures of western blotting showing endogenous CREPT protein expression in all cell lines. Beta-actin (ACTB) is used as a loading control. Numbers under the bands show the mean of the intensity ratios standardized to hmel. *** p < 0.001. All experiments were repeated at least three times.

