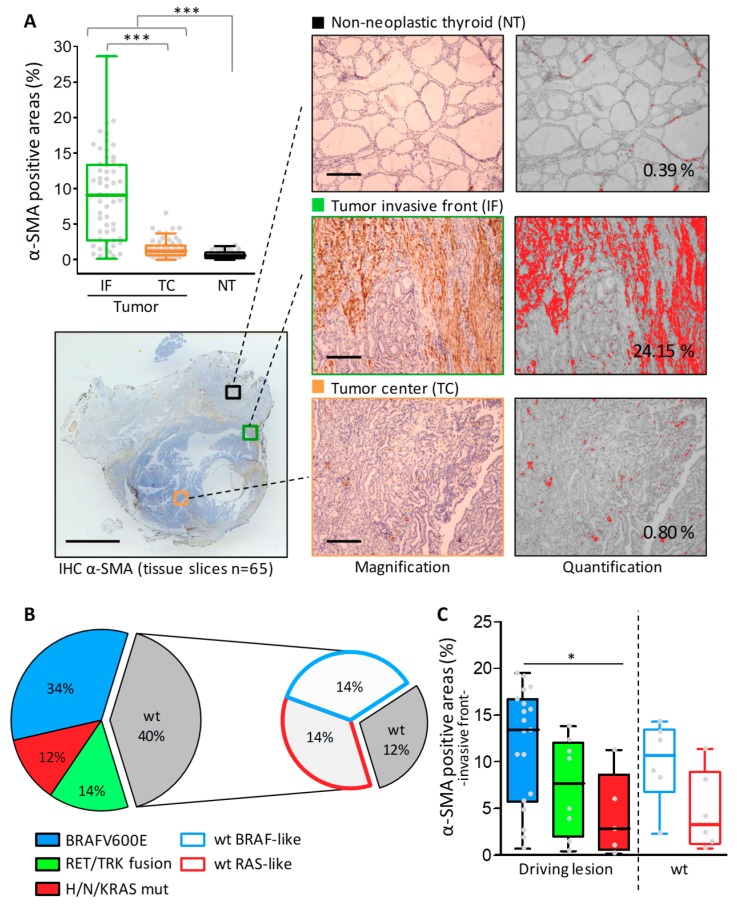
Figure 1.
Cancer-associated fibroblasts (CAFs) assessment by α-SMA immunohistochemical staining in human thyroid cancers. (A) A boxplot with a scatterplot showing IHC results expressed as α-SMA positive areas calculated by image digital quantification on the stained tissues section from non-neoplastic thyroids (NT) and thyroid tumors (scored separately for invasive front (IF) and tumor center (TC)). Each dot represents the mean of 2–3 fields scored for each sample. Below an example of α-SMA stained tissue section (scale bar: 5 mm) with representative scored regions (high magnification, scale bar: 500 μm) and the corresponding ImageJ threshold mask with the measured positive area (expressed as a percentage). (B) Tumor genotyping results. Pie charts represent the distribution of identified driving lesions or BRAF-/RAS-like signaling in tumor tissues; wt: samples with no alterations in the tested lesions. (C) Boxplot with scatterplot showing α-SMA IHC results in tumor samples stratified for genetic driving lesion or BRAF-/RAS-like signaling. *** p-value < 0.0001 and * p-value < 0.05 by Mann-Whitney test.

