Figure 4.
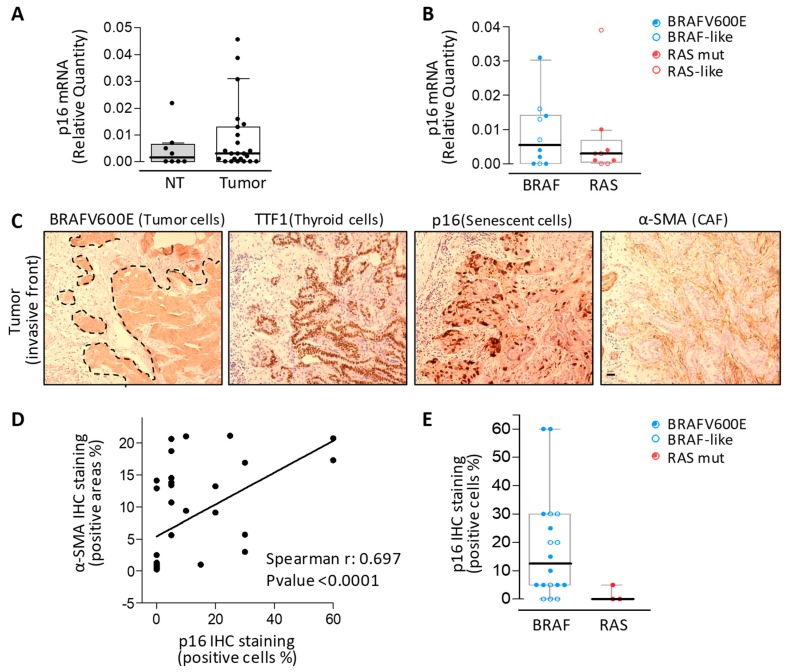
Senescent thyrocytes and CAFs assessment in human thyroid cancers. (A) Boxplot with a scatterplot of p16 mRNA expression by qRT-PCR in non-neoplastic thyroids (NT) and thyroid tumors and (B) in tumor samples stratified for driving lesion or BRAF-/RAS-like signaling. qRT-PCR data are shown as a relative quantity normalized to the HPRT gene used as an endogenous control. Each dot represents the mean of three technical replicates. (C) Representative serial sections of a BRAFV600E mutated thyroid tumor IHC stained with p16 and α-SMA (senescent cells and CAFs markers, respectively). Scale bar: 100 µm. (D) Correlation between α-SMA positive areas and p16 positive cells established by IHC. (E) Boxplot with a scatterplot of p16 IHC staining results in tumors stratified for driving lesions or signaling.

