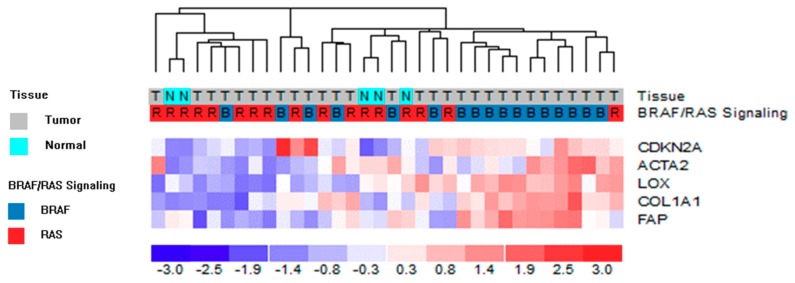
Figure 5.
Unsupervised hierarchical clustering analysis of proprietary gene dataset on 5 tumoral and stromal genes. The color scale bar represents the relative gene expression levels normalized by the standard deviation. Color legend for tissue and BRAF-like/RAS-like signaling is reported. α-SMA and p16 are indicated by the corresponding gene symbol, ACTA2 and CDKN2A, respectively.

