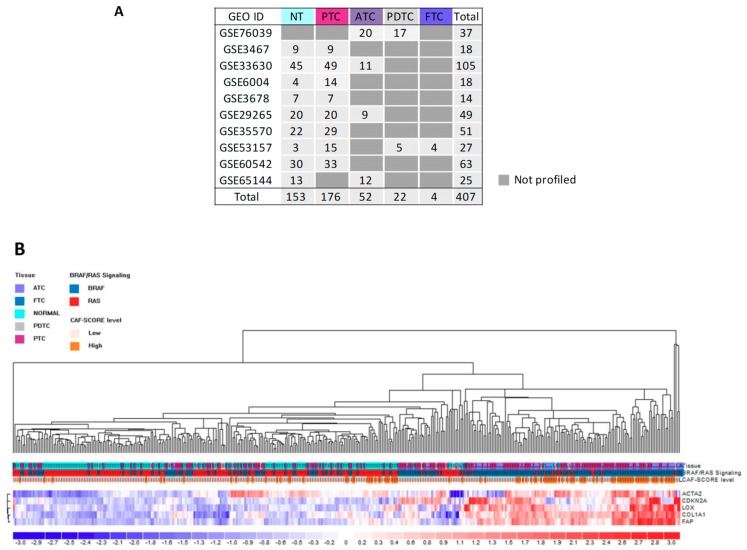
Figure 6.
Assessment of tumoral and stromal derived genes in human thyroid cancers gene sets derived from Gene Expression Omnibus (GEO). (A) Gene sets description. (B) Unsupervised hierarchical clustering analysis of 407 samples derived from GEO datasets on five tumoral and stromal genes. The color scale bar represents the relative gene expression level normalized by the standard deviation. Color legend for the tissue, BRAF-like/RAS-like signaling, and CAF score is reported. α-SMA and p16 are indicated by the corresponding gene symbol, ACTA2 and CDKN2A, respectively.

