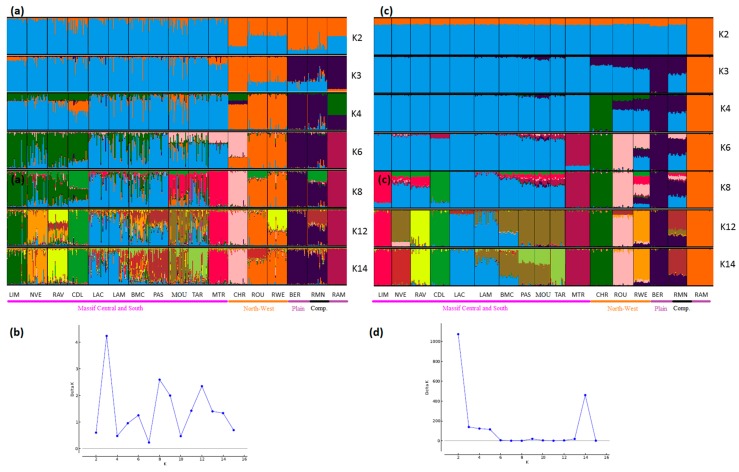
Figure 4.
Genetic structure of French sheep breeds by Bayesian analysis (K = number of clusters). (a) STRUCTURE plot obtained from the microsatellite dataset; (b) graph showing ΔK calculated according to [42] for the microsatellite dataset; (c) STRUCTURE plot obtained from the SNP dataset; (d) graph showing ΔK calculated according to [42] for the SNP dataset. Comp.: composite breeds; information concerning the region of origin of each breed was extracted from [21]; for breed names see codes in Table S1.

