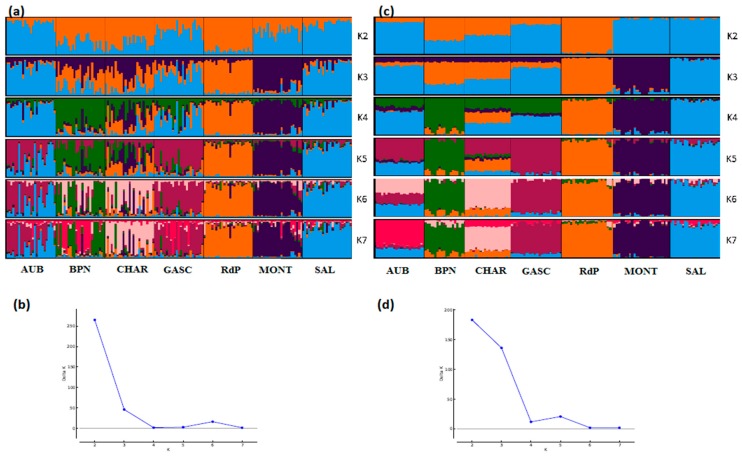
Figure 6.
Genetic structure of French cattle breeds by Bayesian analysis (K = number of clusters). (a) STRUCTURE plot obtained from the microsatellite dataset; (b) graph showing ΔK calculated according to [42] for the microsatellite dataset; (c) STRUCTURE plot obtained from the SNP dataset; (d) graph showing ΔK calculated according to [42] for the SNP dataset. For breed names see codes in Table S1.

