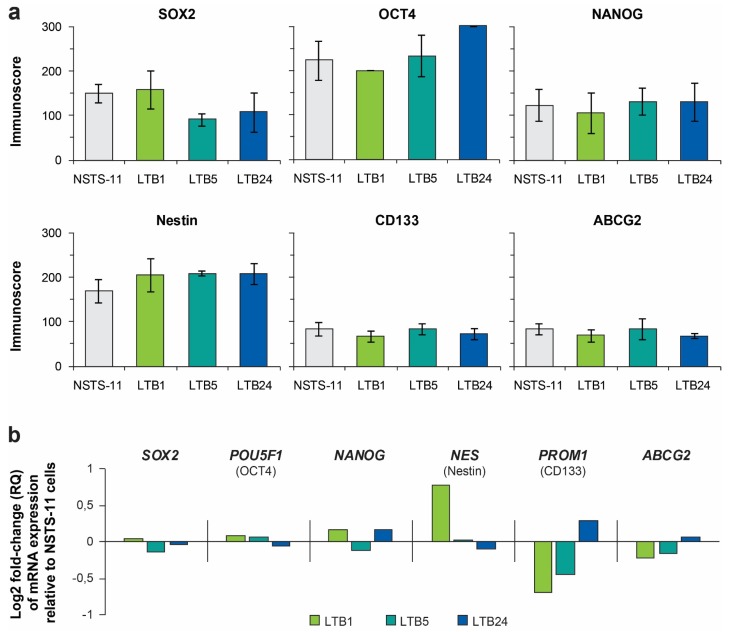
Figure 4.
(a) Immunofluorescence analysis of core pluripotency factors (upper panel) and commonly used CSC markers (lower panel). Immunoscores were determined by multiplying the percentage of positive cells by the respective immunoreactivity. Data are presented as the mean ± SD of at least three independent experiments. (b) Expression profiling data of genes encoding the investigated proteins. Where necessary, the protein name is noted under the official gene symbol.

