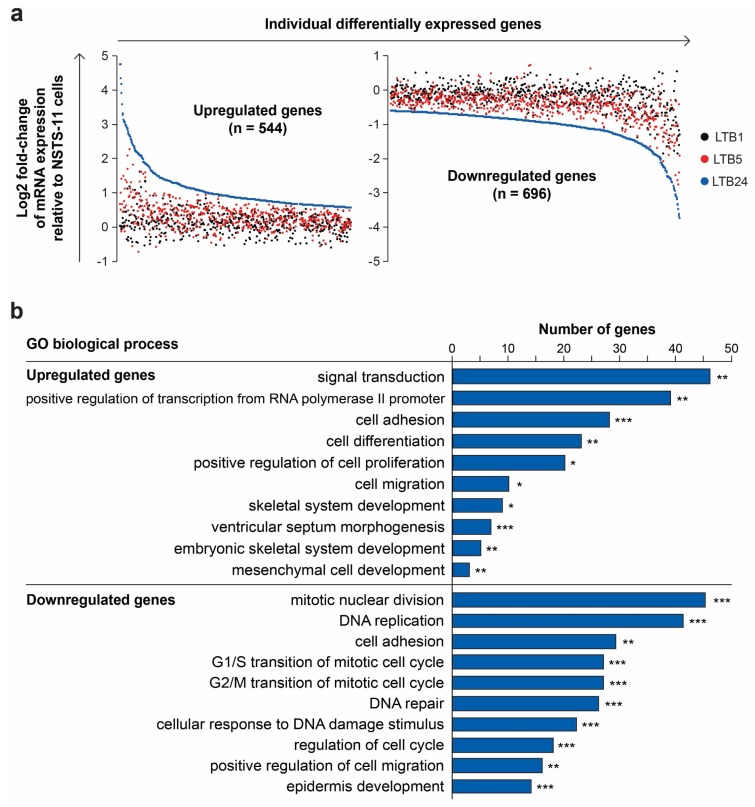
Figure 5.
Analysis of the differentially expressed genes. (a) Expression levels of differentially expressed genes identified by their upward (upregulated genes; left plot) or downward (downregulated genes; right plot) trend of expression over passages in vivo; (b) Gene ontology (GO) analysis of biological processes. The DAVID annotation tool with the GOTERM_BP_DIRECT database was used. Modified Fisher’s exact test, * p < 0.05, ** p < 0.01, and *** p < 0.001.

