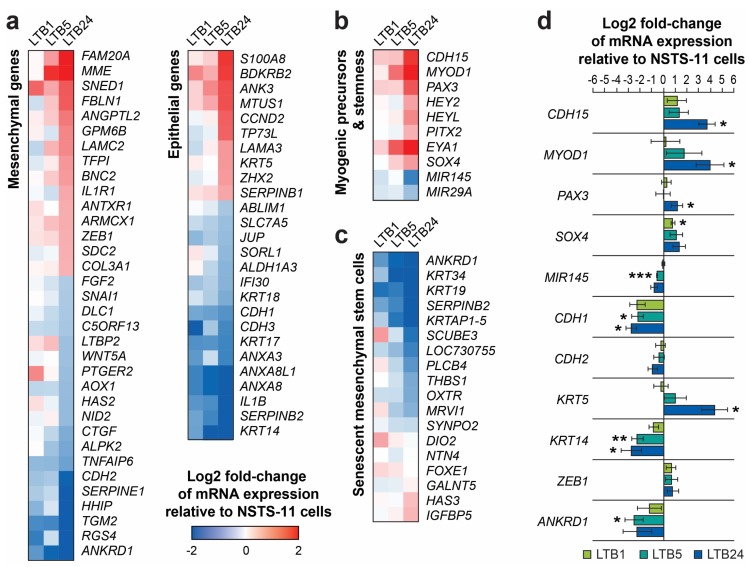
Figure 6.
(a) Expression levels of differentially expressed genes categorized based on their association with a mesenchymal or an epithelial phenotype. (b) Expression profile signature suggesting enhanced stemness and impaired myogenic differentiation. (c) Expression profile of the genes that are associated with senescence of mesenchymal stem cells [25]. (d) qRT-PCR validation of the gene expression profiling data. The expression of all 11 genes tightly reflected the expression profile detected by microarray analysis (see a,b). Data are presented as the mean ± SD of three biological replicates. * p < 0.05, ** p < 0.01, and *** p < 0.001 relative to parental NSTS-11 cells.

