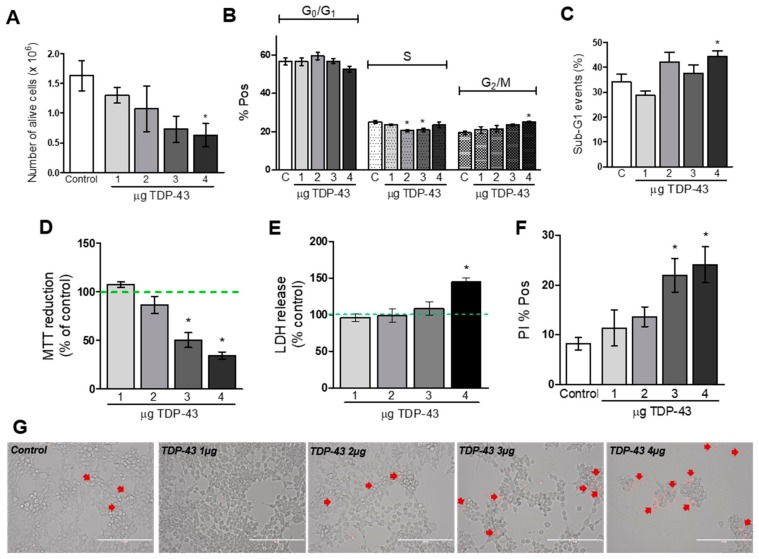
Figure 3.
TDP-43 overexpression induces a decrease in cellular viability measured after 48 h of transfection. (A): Number of alive cells analyzed by trypan blue exclusion (n = 3; * p < 0.05). (B) Cell cycle analysis performed by flow cytometry (n = 4–5; * p < 0.05). (C) Percentage of sub-G1 events (fragmented nuclei) analyzed by flow cytometry (n = 4–5; * p < 0.05). (D) Cell viability analyzed by MTT reduction (n = 4; * p < 0.05). (E) LDH released in the medium (n = 4; * p < 0.05). (F) Percentage of positive cells for PI fluorescence (n = 5–6; * p < 0.05). (G) Microscopic analysis of cells transfected with increasing concentrations of TDP-43 and incubated with PI (scale bar = 200 µm).

