Figure 2.
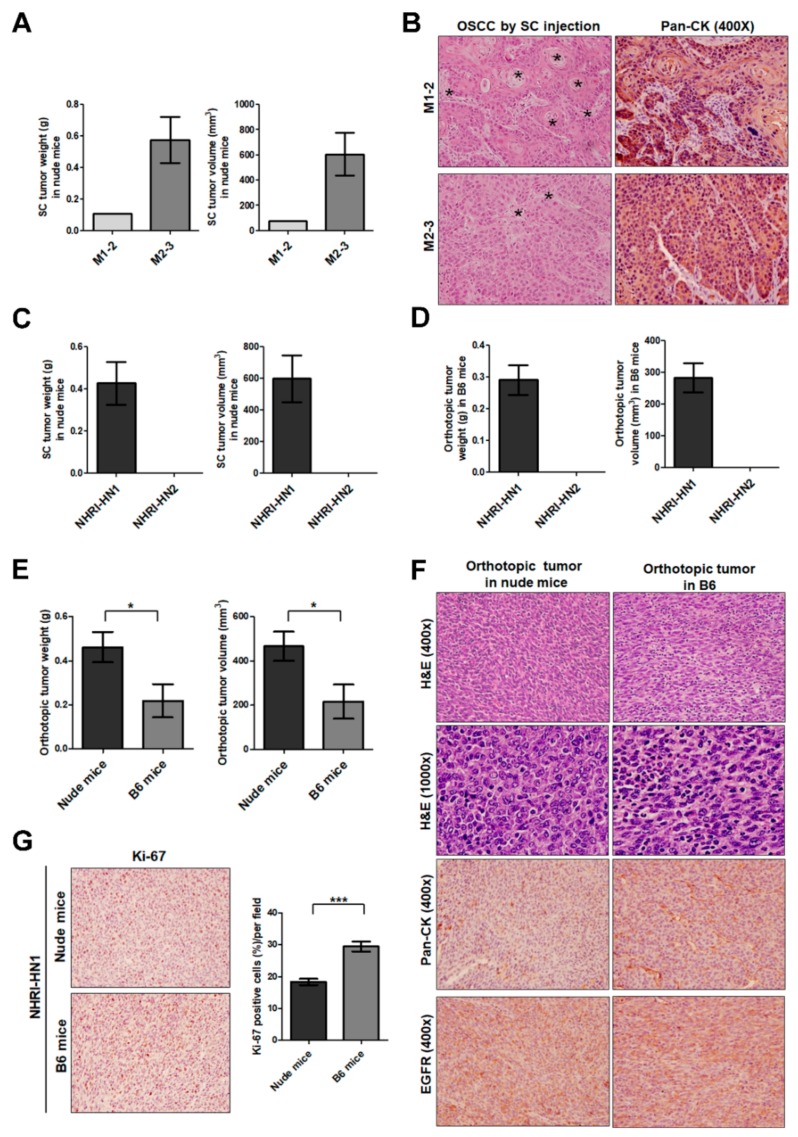
Tumor growth of M1-2 and M2-3 cells in nude mice and B6 mice. (A) Quantification of tumor weights (left panel) and volumes (right panel) in nude mice subcutaneously injected with 106 M1-2 (n = 3) or M2-3 cells (n = 3) and sacrificed at 98 days post-inoculation. (B) Histological examination of the subcutaneous xenografts in nude mice with H&E staining (left panel) and IHC with anti-pan CK (right panel) at 400× magnification. Asterisks (*) indicate representative keratinization and keratin-pearl formation. (C) Quantification of tumor weights (left panel) and volumes (right panel) in nude mice subcutaneously injected with 106 NHRI-HN1 (n = 4) or NHRI-HN2 cells (n = 4) and sacrificed at 42 days post-inoculation. (D) Measurement of the tumor weights (left panel) and volumes (right panel) in B6 mice orthotopically injected with 5 × 10⁵ NHRI-HN1 (n = 20 in total for four independent experiments) or NHRI-HN2 cells (n = 3) and sacrificed at 36–40 days post-inoculation. (E) Quantification of tumor weights volumes in nude mice and B6 mice orthotopically injected with 5 × 10⁵ NHRI-HN1 cells (n = 7 in total for two independent experiments) and sacrificed at 40 or 32 days post-inoculation. (F) Histological examination of NHRI-HN1 tumors in nude mice and B6 mice with H&E staining (upper panels) at 400× and 1000× magnifications and IHC with anti-pan CK (middle panel) and EGFR (lower panel) at 400× magnification. (G) Representative Ki-67-labeled NHRI-HN1 tumors are shown in the left panel. The percentage of positive Ki-67 signals was determined in NHRI-HN1-generated tumors in nude mice and B6 mice. Error bars represent SE. * p < 0.05; *** p < 0.001.

