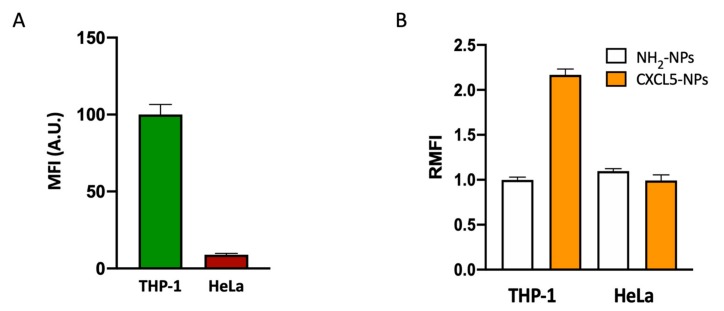
Figure 6.
CXCR2+ cell preferential targeting of CXCL5-NPs. CXCR2 expression (A) and NPs uptake in THP-1 and HeLa cells in serum free conditions (B) evaluated by flow cytometry. The bars represent the median fluorescence intensity (MFI) and the relative median fluorescence intensity (RMFI) of at least three independent experiments ± standard error of the mean (SEM).

