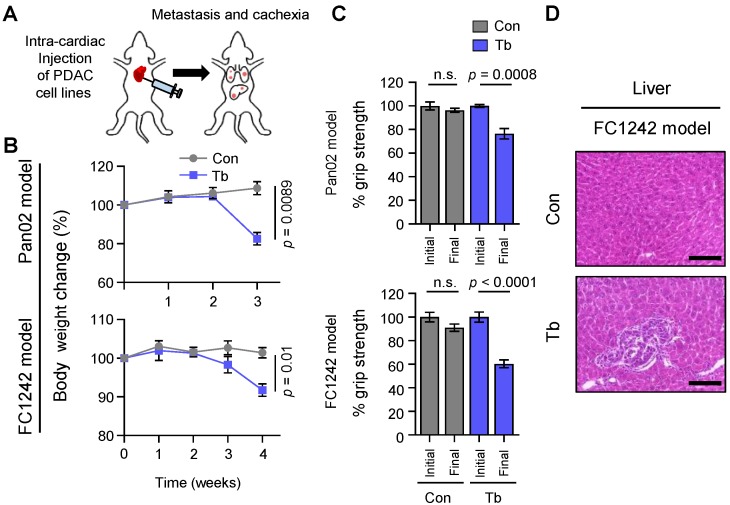
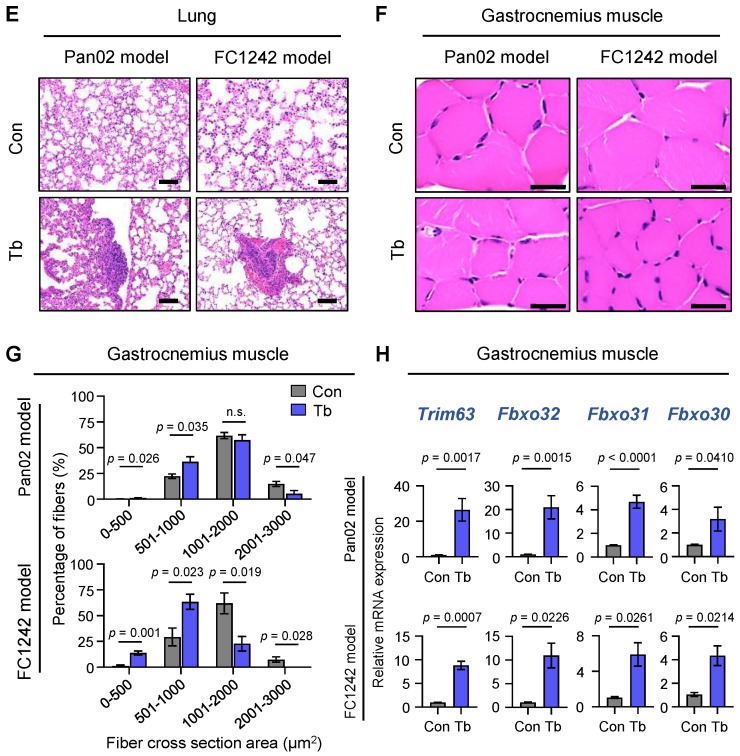
Figure 1.
Cachexia development in experimental metastasis models of pancreatic ductal adenocarcinoma (PDAC). (A) Schematic illustration of intra-cardiac injection of 1 × 10⁵ Pan02 or FC1242 cells into the arterial circulation of mice and the development of metastasis. (B) Body weight analysis of tumor-bearing mice harboring Pan02 and FC1242 metastases (blue lines) compared to controls (gray lines). (C) Measurements of hind-limb grip strength in Pan02 and FC1242 tumor-bearing mice (Tb, blue bars) compared to controls (Con, gray bars) following tumor-cell injection. (D) Representative hematoxylin and eosin (H&E) staining of liver tissue sections from the FC1242 model compared to control. Scale bars represent 100 µm. (E) Representative H&E staining of lung tissue sections from Pan02 and FC1242 mice compared to controls. Scale bars represent 100 µm. (F) Representative H&E staining of gastrocnemius muscle cross-sections from Pan02 and FC1242 mice compared to controls. Scale bars represent 25 µm. (G) Quantitation of gastrocnemius muscle fiber cross-sectional area (CSA) from Pan02 and FC1242 mice compared to controls. Morphometric analysis is shown as distribution frequency of fiber CSA. (H) Results from real-time quantitative reverse transcription PCR (qRT-PCR) analysis of muscle atrophy markers Trim63, Fbxo32, Fbxo31, and Fbxo30 in the gastrocnemius muscles from Pan02 (top) and FC1242 (bottom) mice compared to controls. n = 3–5 mice/group. Data are expressed as mean ± standard error of the mean (SEM). p-values were determined by the two-tailed, unpaired Student’s t-test. n.s.: Not significant; Con: Control; Tb: Tumor-bearing.


