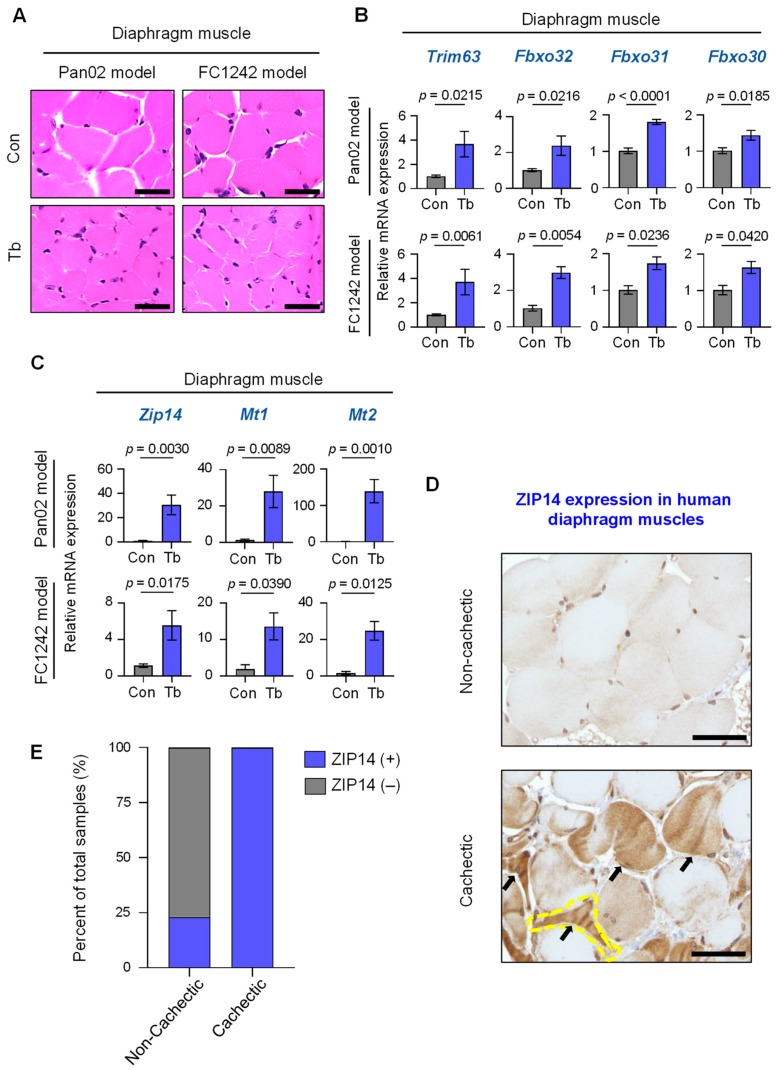
Figure 4.
ZIP14 expression in diaphragm muscles from PDAC models and human patients. (A) Representative H&E staining of diaphragm muscle cross-sections from Pan02 and FC1242 mice compared to controls. Scale bars represent 25 µm. (B) Results from qRT-PCR analysis of Trim63, Fbxo32, Fbxo31, and Fbxo30 in the diaphragm muscles from Pan02 (top) and FC1242 (bottom) mice (Tb, blue bars) compared to controls (Con, gray bars). (C) Results from qRT-PCR analysis of Zip14, Mt1, and Mt2 in the gastrocnemius muscles from Pan02 (top) and FC1242 (bottom) mice compared to controls. (D) Representative images of ZIP14 immunohistochemical analysis of human diaphragm muscle cross-sections from non-cachectic (top, n = 13) and cachectic (bottom, n = 10) pancreatic cancer patients. A representative atrophic fiber is marked by the yellow dotted line. Additional atrophic fibers visualized in the field are marked with arrows. Scale bars represent 25 µm. (E) Blinded scoring of ZIP14-stained diaphragm muscle sections as ZIP14-positive (blue bars) or ZIP14-negative (gray bars) from non-cachectic and cachectic cancer patients. Data are shown as a percentage of total samples and the p-value was calculated using scored sample counts (p < 0.0001). n = 3–6 mice/group. Data are represented as the mean ± SEM. p-values for qRT-PCR analysis were determined using the two-tailed, unpaired Student’s t-test. p-values for immunohistochemical scoring were determined using the Pearson’s chi-square test. Con: Control; Tb: Tumor-bearing.

