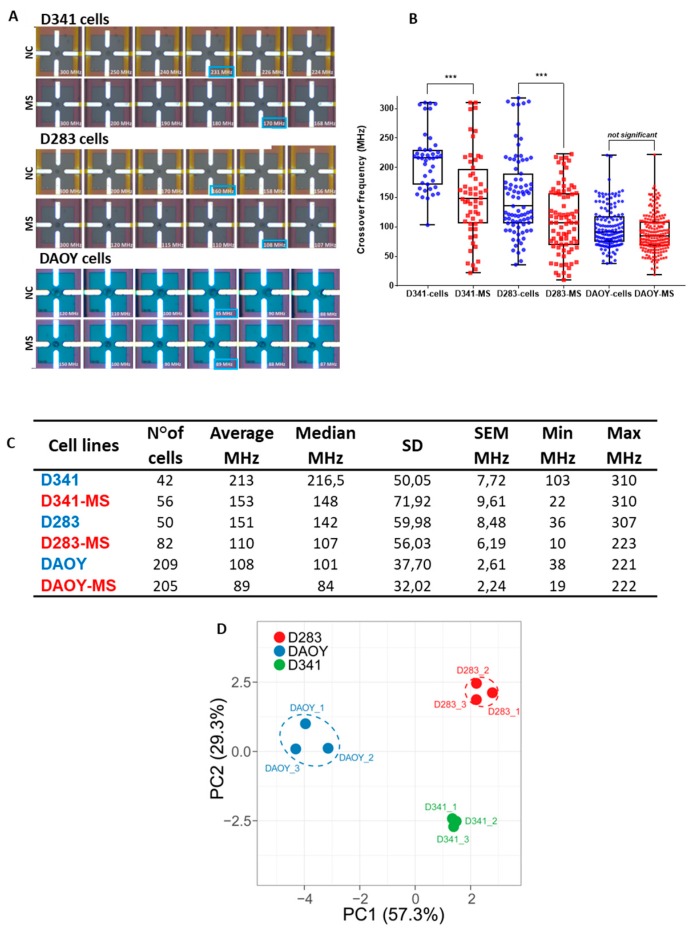
Figure 3.
Crossover frequencies of MB cells. Graphic box plots representation of D341 and D283 cells crossover frequencies, cultured in two different conditions: Normal medium (NC) and MS medium (A,B). The middle bar represents the median value of the collected data. Summary of the statistic parameters concerning the characterization of crossover (C). The p-value was determined using a one-way ANOVA test. Differences in crossover frequencies obtained for each subpopulation show a p-value = 2 × 10⁻⁵. *** p < 0.0001. Graphic representation of the Principal Component Analysis (PCA) generated by unit variance scaling of data and SVD calculation of components through the ClusVis web tool (D).

