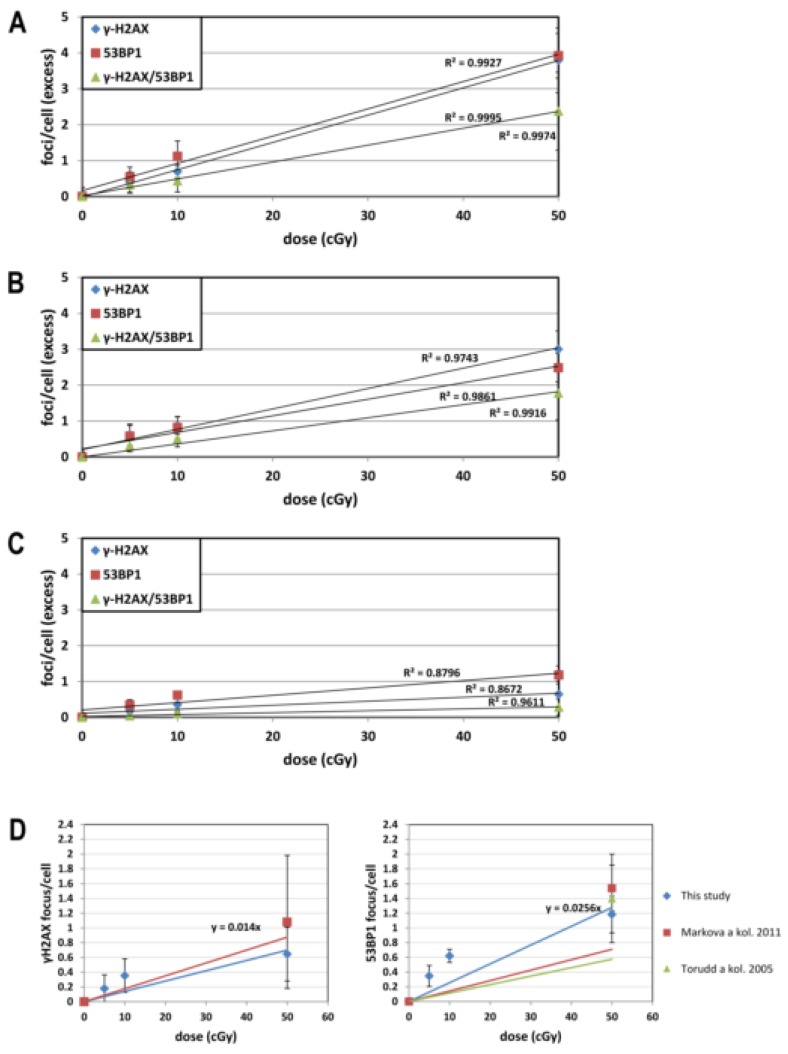
Figure 4.
Linear fit for dose dependence of γH2AX, 53BP1, and γH2AX/53BP1 foci. Dose dependence of IRIF and linear regression along with the coefficient of determination R2 is shown for different post-irradiation time points: (A) 30 min, (B) 2 h, and (C) 22 h. Data from 3 experiments are shown for each dose (0, 5, 10, and 50 cGy). Panel (D) shows linear responses for residual foci measured 22 h post-irradiation (blue) and our extrapolations from high doses reported by Markova et al. [31] (red) and Torudd et al. [32] (green).

